.gif)



Every August, someone in a German office says it: Sommerloch. The "summer hole". The stretch where schools are closed, politicians (and famously VCs) go on vacation for weeks and for everyone in business: deals stall, inboxes go quiet, and nothing seems to move until September. We are a German company, so we hear it a lot. We also sit on the monthly financials of dozens of tech companies, so this year we did the obvious thing and checked whether the infamous Sommerloch is real.
The short answer: for revenue, barely. For signing new customers, yes, and more sharply than we expected. But the useful answer is: There is no single SaaS season. Some companies slump in summer, roughly as many slump in winter, others in spring or autumn, and a large share barely move at all. Your seasonality is yours, so benchmarking it against a "SaaS average" will mostly mislead you.
Let’s dive into the data, and understand what to do with it.
The dataset
We looked at 82 tech and recurring-revenue companies, using their real monthly financials. As lengthy summer vacations aren’t a purely German phenomenon, we opted to look at companies across Germany, the UK, and the Netherlands. For the pattern work we used the 59 companies with enough history to trust (at least ~31 months, and at least three observations per calendar month), which gave us up to eight years of data per company.
For each company we stripped out its underlying growth trend, which helped us to understand individual dynamics instead of aggregating “one trend for everyone”. We compared each month against that company's own 12-month trend. An index of 1.00 means the month landed exactly on trend. 0.90 means 10% below. This keeps a small startup and a scaled company on the same footing, which keeps growth from masquerading as seasonality.
So, keep in mind: the whole analysis is about deviation from a company's own normal, not against another company.
Get funding without giving up equity
Find out if your company is ready for debt financing in 60 seconds
Check fundability nowFinding 1: The revenue Sommerloch is mostly a myth
In our data, median revenue in August sits about 4% below trend. That is real, but it is small. And to directly address the Sommerloch-shaped elephant in the room: August is not even the weakest revenue month. February, May, June, and July all sit lower.
Revenue, in other words, is remarkably flat across the year for most companies. And this shouldn’t come as a surprise, as it is the whole point of a subscription model. When customers pay monthly or annually on rolling contracts, this month's revenue is mostly last month's revenue plus a little. Demand can swing hard while revenue barely notices and the recurring model smooths the bumps by design.
So if you run a subscription business and your revenue holds through August, you are just watching your business model do exactly what it is built to do.
Finding 2: The Sommerloch is real, it just hides in acquisition
The picture changes completely when you look at when companies actually sign new customers.
Median new-customer acquisition in August runs about 26% below trend, and 71% of the companies we looked at sign fewer customers in August than their own baseline. Across the year, acquisition is roughly 3.5 times more seasonal than revenue. So yes, the summer lull is real and we can name it: the acquisition Sommerloch.

Your team sells less in August, deals slip, onboarding slows. But because your existing customers keep paying, the revenue line stays calm and the slowdown never shows up where most founders look.
The clearest single example in our data is a company that sells software into schools. Its revenue holds in a tight band all year, moving only a few points month to month. Its new-customer acquisition swings from nearly four times trend in January down to about a third of trend in spring. One company, two completely different stories, depending on whether you look at revenue or at signings. The school calendar drives when it wins customers but the subscription model hides that fact in the revenue.
We were of course also interested in understanding: if acquisition in August slows down, does it recover when everybody’s back from holidays? In our data it does not snap back in September the way the "back to work" story suggests. Signing stays soft from May through October and only really rebuilds in the new year, with January and March the strongest months for new customers. If you plan your hiring, quota, and ad spend around a big September bounce, the data would gently push back.
Finding 3: There is no single SaaS season
If you are looking for one takeaway from this piece, here it is: yes, SaaS can be seasonal, but its seasonality comes in many different shapes and forms.
When we measured how seasonal each company's revenue actually is, we found a full spread. About 37% are strongly seasonal. Another 24% are moderately seasonal. Around 22% are mild. And roughly one in six are essentially flat, with revenue holding within a couple of points of trend every month for years.
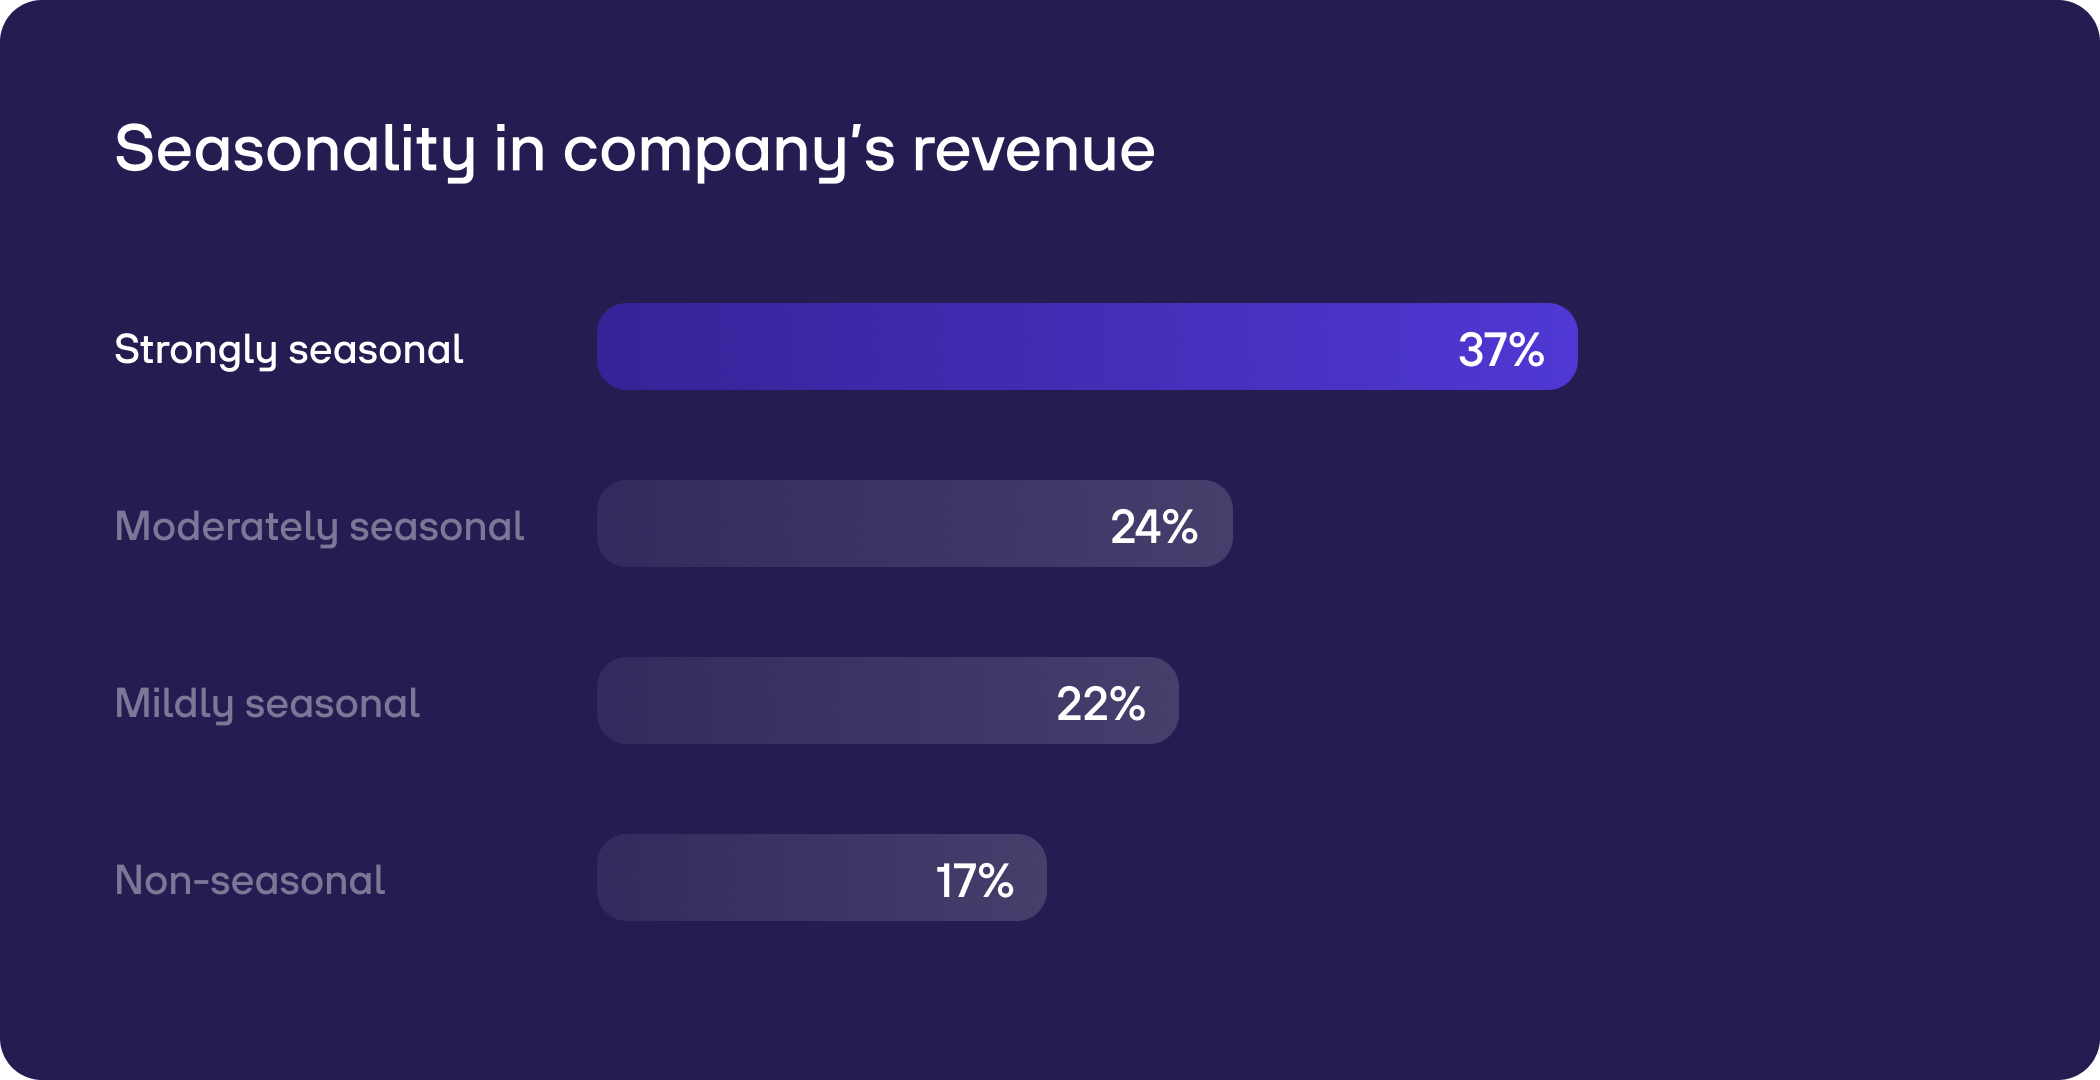
More striking is when the seasonal companies dip. If the Sommerloch were the universal SaaS pattern, troughs would cluster in summer. They don't. Among the companies with real seasonality, summer is the single most common low season, but it accounts for only about four in ten. The rest bottom out in winter, autumn, or spring.
A few patterns from the data, described by what the businesses do:
- A business that rents out construction equipment peaks hard in summer and troughs in deep winter. Its July revenue runs around 1.4 times trend while January sits near a third of trend. That is the opposite of a Sommerloch.
- A tax-filing tool shows two peaks, one in January and one in late summer, tracking filing deadlines. Its quiet months are spring and early summer.
- Horizontal tools used year-round, like a co-browsing product and an SEO platform, sit almost perfectly flat. One held its revenue between 0.99 and 1.02 for eight straight years. For companies like these, "seasonality planning" is a non-question.
The takeaway is practical: Know exactly what your season is, set by who your customers are and what makes them buy. A construction-equipment business and a tax tool should run their year in almost opposite directions, and both would be wrong to copy a generic "SaaS benchmark."
Where seasonality costs you: cash, and only sometimes
If your revenue is smooth, does any of this hit your bank account? For most companies, honestly, no. If you bill monthly, your cash is about as smooth as your revenue. Seasonal demand comes in, gets amortized across rolling monthly payments, and your account never feels a cliff. A seasonal acquisition pattern is a planning question for you but doesn’t negatively affect your cash flow.
The exception, of course, is annual billing. If you invoice for the year upfront, and your new business clusters in a season, your cash arrives in bursts while your costs stay level. Now the seasonality is real money. You carry the quiet months on cash you banked earlier, and a slow signing season this year becomes a thinner cash cushion next year.
We saw this directly when we checked one strongly seasonal company's actual bank inflows against its revenue pattern. The seasonality was real in the cash. The cash peak even lagged the revenue peak by a month or two, which is exactly what payment terms do: the money lands after the sale, so the trough in the bank is deeper and later than the trough in the books. For an annual biller with a real seasonal shape, that gap is the thing to manage.
So the honest map looks like this. Flat or monthly-billing company: seasonality is interesting, not threatening. Annual biller with a genuine seasonal shape: seasonality is a working-capital question, and worth planning for.
What to do about your season
Start by finding out whether you even have one. Pull two years of monthly data. Detrend it against your own growth. Look at revenue and at new-customer acquisition separately, because as we have seen, they can tell opposite stories. Many founders have never looked at the acquisition line on its own. If you haven’t, take a look.
If you find a real pattern, you have three moves.
Plan to it. Line up hiring, campaign spend, and quota with your actual signing rhythm instead of a generic calendar. If your customers go quiet in August, stop expecting August to carry the quarter, and load the pipeline before and after it.
Hold a buffer. If you are an annual biller with a seasonal shape, size your cash cushion to the trough, not the average. The average month will lie to you about the quiet one.
Fund the shape. For annual billers with a genuine seasonal swing, non-dilutive financing can smooth the gap directly. You draw capital going into the quiet season and repay through the busy one, so a lumpy cash pattern stops dictating what you can spend on growth.
That last move is our own lane, so treat it as disclosed bias rather than neutral advice. re:cap gives recurring-revenue companies non-dilutive capital and the analysis to know when to use it. The reason we find seasonality worth writing about is that we see, in the numbers, how often a healthy business gets squeezed not by weak demand but by the timing of its cash. That is a fixable problem. It shouldn’t have to cost you a share of your company.
But the first step costs nothing and needs no product. Look at your own two lines, revenue and acquisition, detrended. You will learn more about your business in an afternoon than any "SaaS seasonality benchmark" can tell you.
Method and limits
We analysed 82 tech and recurring-revenue companies in the re:cap portfolio across Germany, the UK, and the Netherlands, using anonymised monthly financials. Pattern and strength findings use the 59 companies with at least ~31 months of history and at least three observations per calendar month. Companies with thin histories were excluded from those findings, because one or two data points per month produce false spikes that look like seasonality but aren't.
For each company we computed a 12-month centered moving-average trend and expressed each month as a ratio to that trend, then averaged those ratios by calendar month. We report medians rather than means where distributions are skewed, which they usually are.
Two honest limits. First, this is one investor's portfolio, weighted toward European B2B software and recurring-revenue businesses, not a random sample of all tech. Second, this describes patterns, not proven causes. When we suggest why a company is seasonal, that is informed interpretation from what the business does.
FAQ
Is SaaS revenue seasonal?
For most companies in our data, only mildly. Median revenue in August ran about 4% below trend, and August was not even the weakest month. Subscription billing smooths demand into a fairly flat revenue line.
When do SaaS companies sign the most new customers?
In our data, January and March are the strongest months for new-customer acquisition. May through October is the soft stretch, with August the weakest by a clear margin, around 26% below trend.
Is the "Sommerloch" real for tech companies?
Yes, but in acquisition, not revenue. About 71% of the companies we looked at signed fewer new customers in August than their own baseline, while revenue held steady.
Which months are worst for B2B SaaS?
There is no universal worst month. Among seasonal companies, summer troughs are the single most common but account for only about 40%. The rest bottom out in winter, autumn, or spring, depending on the business.
Does seasonality affect cash flow?
For monthly billers, rarely. For annual billers whose new business clusters in a season, yes: cash arrives in bursts while costs stay level, which is a working-capital gap worth planning for.
How do you fix seasonal cash flow?
Plan spending to your real signing rhythm, hold a cash buffer sized to your trough, or use non-dilutive financing to draw capital in the quiet season and repay in the busy one.
Get funding without giving up equity
Find out if your company is ready for debt financing in 60 seconds
Check fundability now