


Prioritization of SaaS metrics is essential for every SaaS business, given the multitude of metrics available. Their significance varies based on strategy and market dynamics.
Yet, how do you identify the most pertinent metrics for an initial assessment of a SaaS company?
In this article, you'll learn
- The 6 most important SaaS metrics
- How to calculate them
- How to read them
- How to use them to optimize a SaaS business
TL;DR
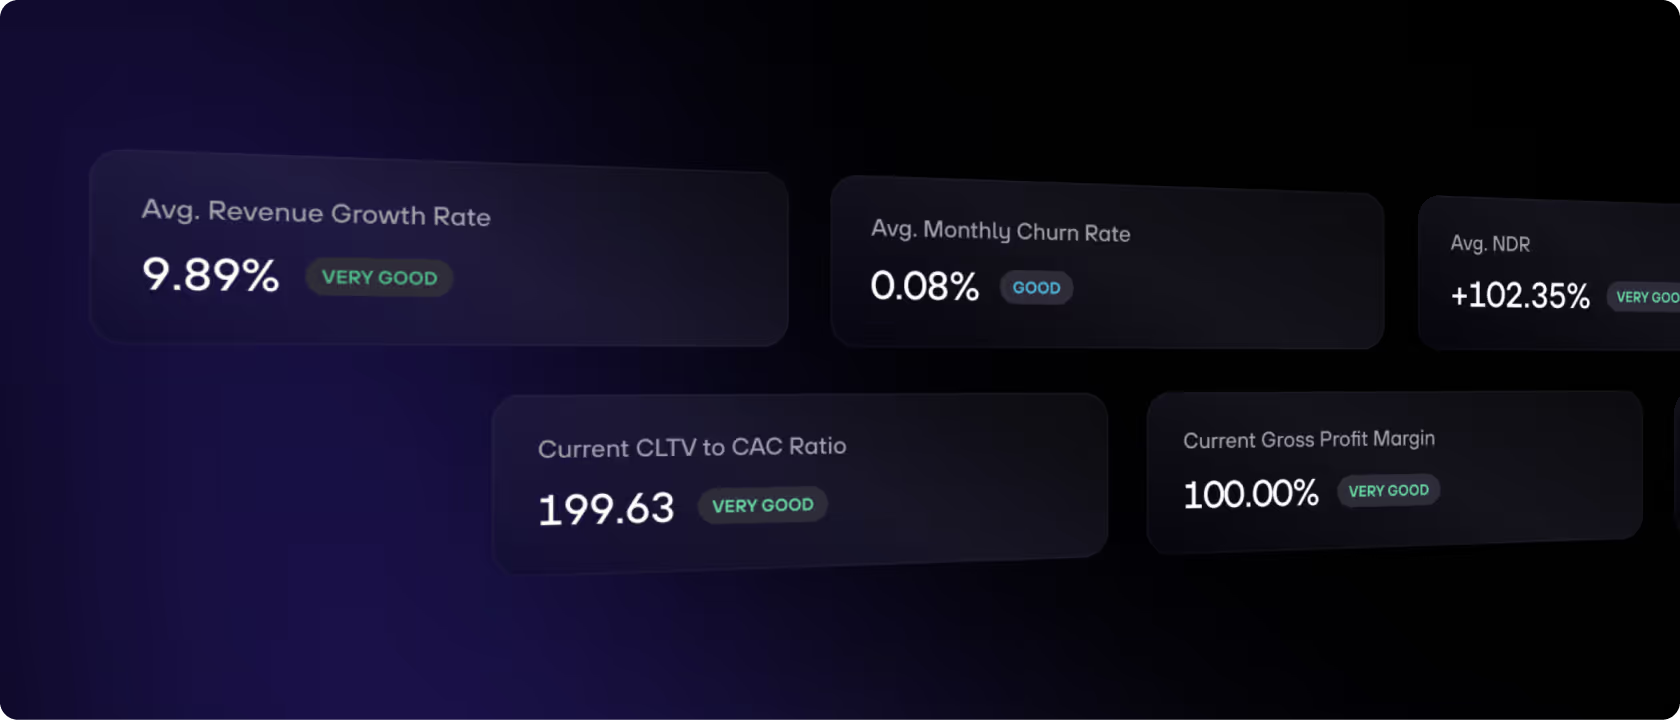
- SaaS metrics reveal business health and growth potential: KPIs like MRR Growth Rate, Customer Concentration, Net Dollar Retention, and Churn Cohort Analysis help track revenue, retention, and customer dynamics.
- Efficiency is the new growth: metrics like Burn Multiple, Cash Runway, and the CLTV-to-CAC ratio indicate how capital-efficient and a SaaS company’s growth really is.
- Metrics must match your stage: early-stage, loss-making startups should focus on growth, profitable ones on efficiency. Choosing the right metrics depends on where you are and where you're going.
Definition: What are SaaS metrics?
SaaS metrics are key performance indicators (KPIs) that help measure the health, growth, and efficiency of a Software-as-a-Service business (SaaS).
Those metrics track customer acquisition, retention, revenue, and costs. Understanding metrics like Customer Lifetime Value (CLTV), Monthly Recurring Revenue (MRR), and Churn Rate gives insights into how well a company is scaling and retaining users.
Once you grasp these core metrics, you’ll have a solid foundation to explore the rest.
Understanding SaaS metrics
If you're running or evaluating a SaaS business (e.g., for SaaS financing), understanding its metrics isn’t optional. It's essential.
These numbers go far beyond traditional financial statements. They tell the real story of how a SaaS company grows, retains customers, and uses capital.
And they help you to run your business more efficient, think of operational efficiency that reduces your cost of capital over time.
Compare yourself against competitors
We build a benchmarking tool with which you can compare your company to 4,000+ SaaS companies – for free!
See your benchmarksSaaS relies on recurring revenue
Unlike classic businesses that sell one-time products, SaaS operates on recurring revenue. You’re trying to build a long-term relationship that pays off over months or even years.
This means: customer acquisition cost, churn, and lifetime value suddenly become more important than this quarter’s revenue.
It also means growth can be deceptive.
A company might show impressive top-line numbers while silently leaking customers, overspending to acquire them, or relying too heavily on a few big accounts. SaaS metrics help you see the full picture. They show how healthy, scalable, and sustainable the business really is.
SaaS businesses play by different rules. Their metrics are the scoreboard. And if you don’t know how to read it, you won’t know who’s really winning.
The 6 most important SaaS metrics founders must know
SaaS companies and subscription-based businesses rely on specific metrics to measure their performance and company value.
However, the extensive array of available metrics, each with distinct calculation methods, can make it hard to identify the most relevant ones for SaaS businesses.
But you have to start somewhere. These six SaaS metrics will help you to get a first overview of a SaaS company’s performance:
- MRR Growth Rate
- Customer Concentration
- Net Dollar Retention and Churn Cohort Analysis
- Burn Multiple and Cash Runway
- CLTV-to-CAC ratio
- Gross Profit Margin
Other relevant SaaS metrics
We know, of course, that there are more than 6 relevant SaaS KPIs to use for a SaaS company to evaluate its business. Here are other SaaS metrics to focus:
- ARR (Annual Recurring Revenue): total yearly recurring revenue from subscriptions, excluding one-time fees.
- ARPU (Average Revenue per User): average monthly or annual revenue generated per customer.
- Revenue Churn Rate: percentage of recurring revenue lost from downgrades or cancellations.
- DAU/WAU/MAU (Daily/Weekly/Monthly Active Users): number of users engaging with the product in a given timeframe.
- Time to Value (TTV): time it takes for a new customer to realize the first meaningful benefit from your product.
- Quick Ratio – Compares revenue growth to revenue loss to assess momentum (Expansion + New MRR) / (Churned + Contraction MRR).
- Lead Velocity Rate (LVR): month-over-month growth rate of qualified leads.
- Burn Multiple: how much cash you burn to generate one dollar of net new revenue.
- Net Promoter Score: Measures customer loyalty by asking: "How likely are you to recommend us to a friend or colleague?"
How do you choose the right SaaS metrics that fits your company?
It is essential to recognize that not every metric is equally relevant to every SaaS company.
The selection should be tailored to the company's unique business model, strategic goals, and phase, whether it's profitable or loss-making.
For early-stage companies that are already profitable, efficiency-related KPIs are crucial. These metrics emphasize cost management and scalability, aligning with a stable business model.
Contrarily, for early-stage companies facing losses, growth-oriented KPIs take precedence. These focus on expansion and capturing market share to reach profitability.
Selecting the most suitable metrics for a SaaS company is a subjective decision. It depends on the specific attributes of the company. Nonetheless, there are generally valid KPIs when assessing the performance of a SaaS business.
Let's dive into the six metrics every SaaS company should know.
We categorized them regarding:
- Revenue and customers
- Efficiency
- Financial health
What are the SaaS metrics you need to know about revenue and customers?
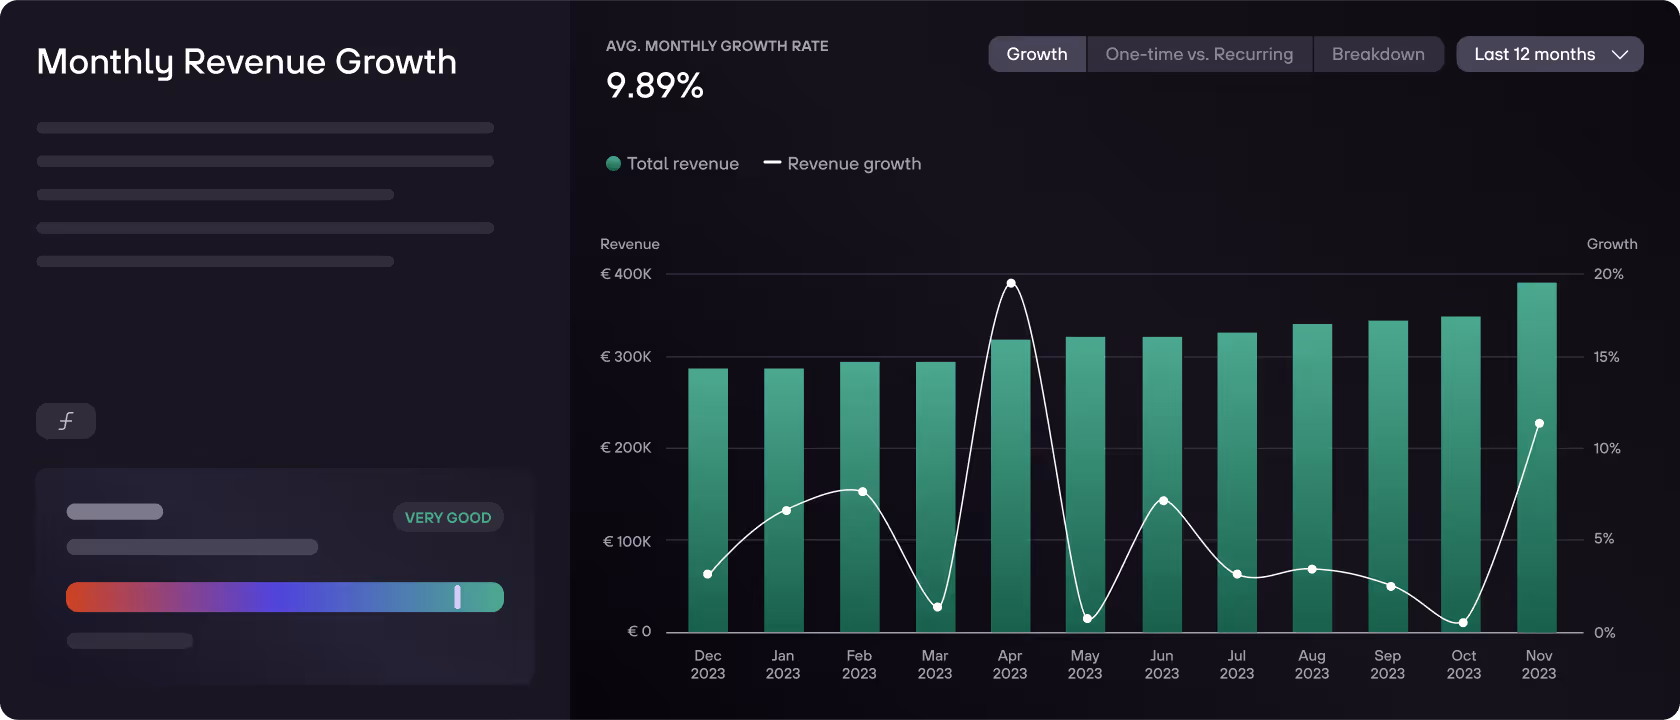
MRR Growth Rate
Monthly Recurring Revenue (MRR) represents the total monthly revenue generated by a SaaS company from all its active customers.
The same applies to Annual Recurring Revenue (ARR) but on a yearly basis. To be characterized as ARR or MRR, the contract must be recurring. One-time revenue, such as the setup fee, is not included.
SaaS companies can use the KPI "Compound Monthly Growth Rate (CMGR)" to precisely measure the growth of their MRR.
Example calculation MRR Growth Rate
The metric for MRR growth rate is calculated: (Final Month Value / Initial Month Value) ^ (1 / number of months) – 1.
For example, a software company starts the year with €100,000 MRR in January and ends the year with €1m MRR in December. So, over 12 months, the software company has a CMGR of 21%.
However, it’s not only important to look at bare numbers or metrics. To better understand changes in MRR over time, it is helpful to break it down into different components, such as:
- MRR retained from existing customers
- MRR added from existing customers (e.g., changes subscription plan)
- MRR added from new customers
- MRR added from former customers
- MRR lost from customer downgrades (e.g., changes subscription plan)
- MRR lost from churned customers (canceled subscription)
The MRR Growth Rate allows businesses to monitor growth trends on a short-term basis, helping them to adjust their growth strategy quickly. The ARR Growth Rate offers a more comprehensive view of the company's recurring revenue potential over the long term.
How to read MRR Growth Rate
SaaS businesses will find a lot of different suggestions on what a proper MRR Growth Rate KPI looks like at different amounts of revenue. In the end, it depends on a company’s stage and strategy, whether it’s loss-making or profitable.
As a rule of thumb, early-stage companies should have higher growth rates than companies at a later stage.
The OpenView Benchmarking Report from 2024 states these numbers for year-over-year growth rates:
- ARR <$1m → 90% yoy growth
- ARR $1-5m → 58% yoy growth
- ARR $5-20m → 35% yoy growth
- ARR $20-50m → 24% yoy growth
- ARR >$50m → 25% yoy growth
With re:cap, SaaS companies can assess their MRR Growth Rate on a granular level and compare their performance to their peers.
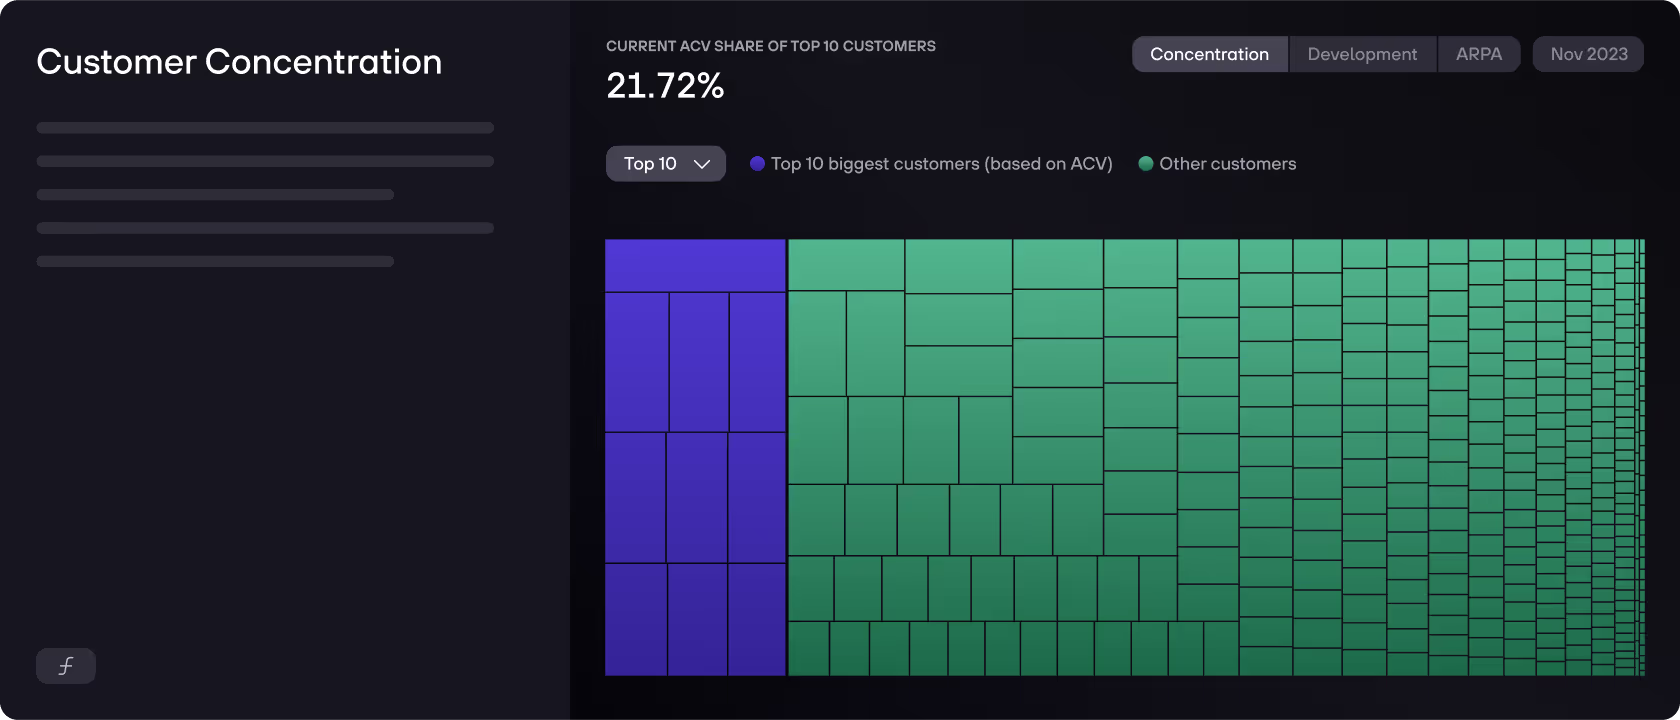
Customer Concentration
Customer concentration refers to how revenue spreads among a company's customer base. It reveals how reliant the business is on a few clients. Do big contracts or numerous small ones drive the growth?
An insufficient diversification of a customer base can result in problems such as:
- Subscription cancellations can be a threat to your revenue
- Customers have too much pricing power
- Customers influence your product roadmap
- An unpredictable revenue stream
That's why maintaining a diverse customer base is essential to avoid dependency on a small number of accounts.
Example calculation Customer Concentration
The metric for customer concentration is calculated: (Customer with the highest revenue in one year / total revenue)*100.
For example, if the highest revenue from one customer is €1M per year and the total revenue is €10M then Customer Concentration is 10%.
How to read Customer Concentration
The resulting number is the percentage of your customer concentration. As a rule of thumb: SaaS companies should keep no more than 10% of their revenue coming from a single customer or over 25% from their top five customers.
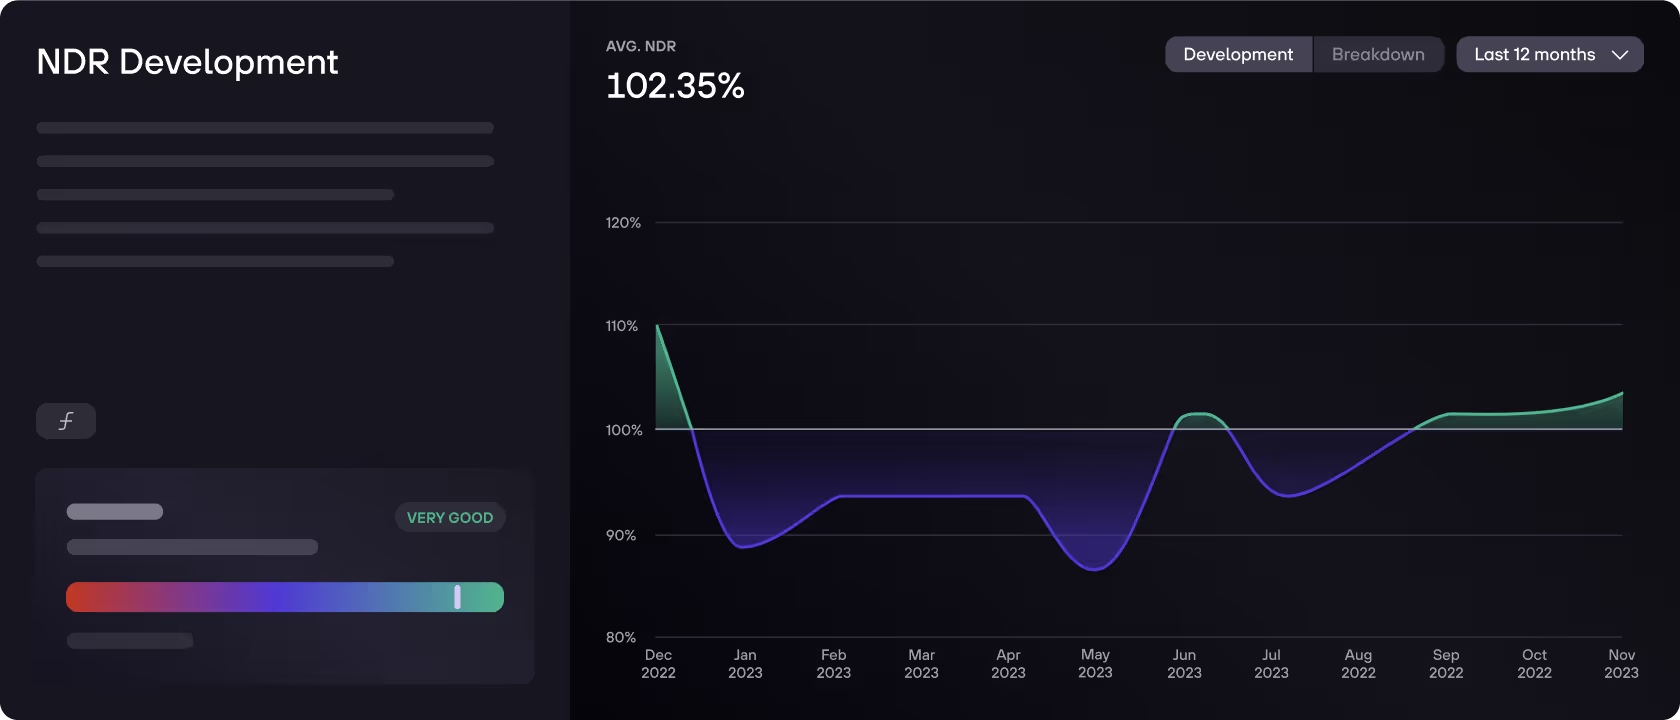
Net Dollar Retention (NDR) and Churn Cohort Analysis
The Net Dollar Retention (NDR) describes how much revenue a group of customers (cohort) is generating in a specific period relative to its initial revenue value.
To better understand this metric and its value SaaS businesses must look at churn cohorts. A cohort analyzes customers by grouping them according to their sign-up period. By doing that, companies can track how many sign-ups of the original cohort remain over time, or how many cancel their subscriptions. This indicates if a SaaS company loses customers and/or revenue through canceled subscriptions.
In other words: it shows a SaaS company whether its product works or not.
Does a product work or not?
The NDR measures how much revenue a cohort generates in each period relative to its original size. It’s a percentage reflecting how the recurring revenue has grown or shrunk within a defined period for a given cohort of customers. It takes upgrades, downgrades, and churn into account.
It also impacts a company’s CAC (Customer Acquisition Cost). A high churn rate is an indication of a "leaky bucket". However, controlling this leaky bucket keeps the CAC low.
Example calculation Net Dollar Retention
Various variables can be used to describe the calculation of this metric. SaaS companies look at NDR as a percentage of the starting MRR or ARR.
The KPI includes the generated starting ARR and any expansion of the starting customer base, minus any churn or downgrade of contracts.
Net Dollar Retention = (Ending ARR + Expansion ARR – Contraction ARR / Starting ARR) * 100
- Starting ARR is €1m
- Ending ARR is €1,2m
- Expansion ARR is €125.000
- Contraction ARR is €75.000
In this example, the NDR is 125%, indicating a 25% increase in revenue from existing customers during the measurement period.
How to read Net Dollar Retention
An NDR can be more than 100% if expansions exceed churned and contracted revenues. If the SaaS metric is less than 100%, it’s evidence of a leaky bucket, meaning a company loses customers from one cohort over a specific period.
The best products and solutions are sticky: customers rarely churn and increase their value to a company over time as they experience greater benefits from a company’s solution.
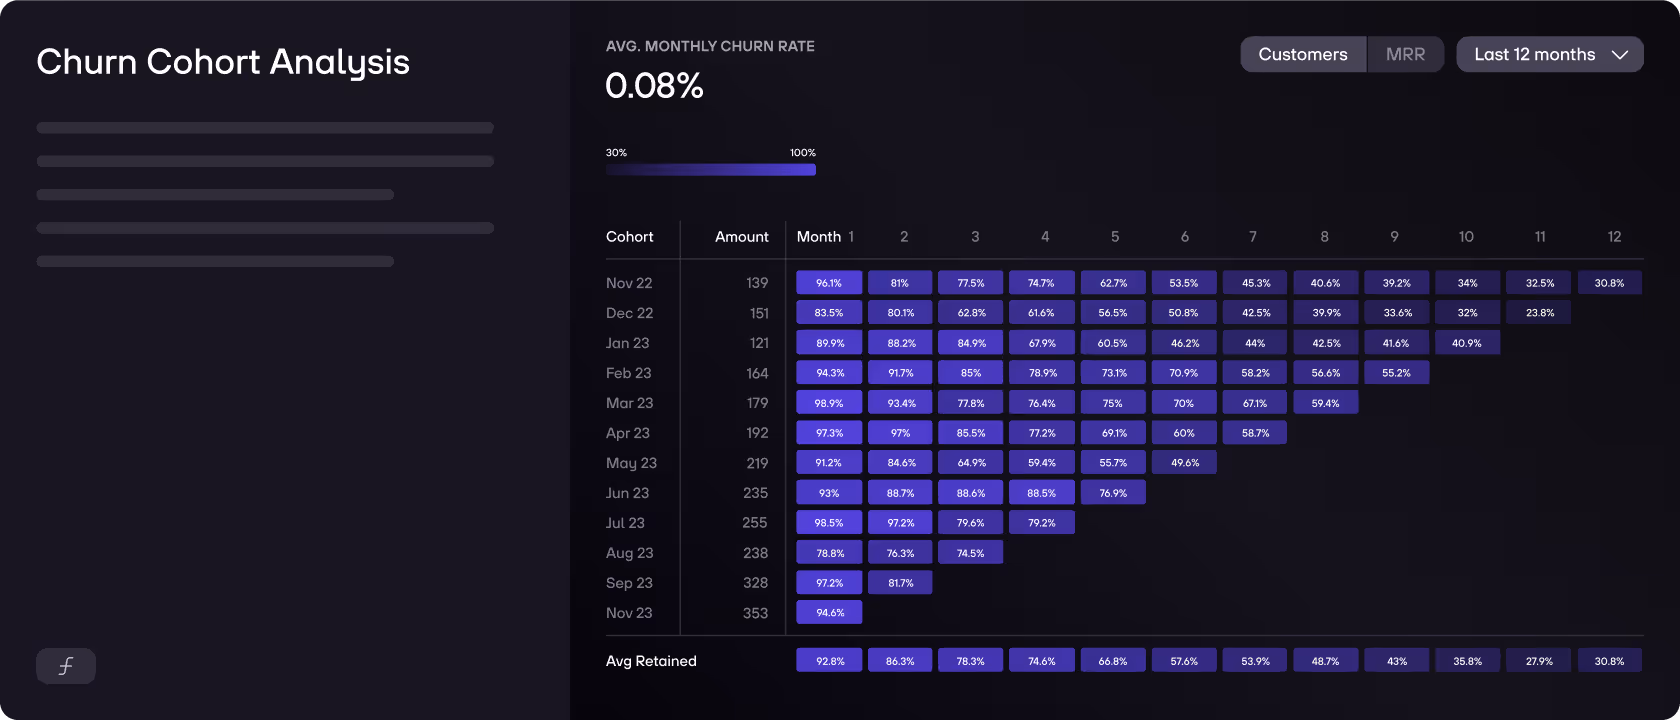
The value of the churn cohort analysis
A churn cohort analysis helps subscription-based businesses understand in which cohort how many users cancel their subscriptions.
Now, if a company compares cohorts it provides them valuable insights into how customers respond to different actions or changes a business has made to its product, e.g., the onboarding approach.
It discloses mismatches between a company’s product and customer expectations. SaaS companies get insights on how to reduce early churns by taking action on questions like:
- Does the product experience match my customers’ expectations?
- Does my onboarding process need some improvement?
- Do I acquire and/or activate my users properly?
What are the SaaS metrics you need to know about efficiency?
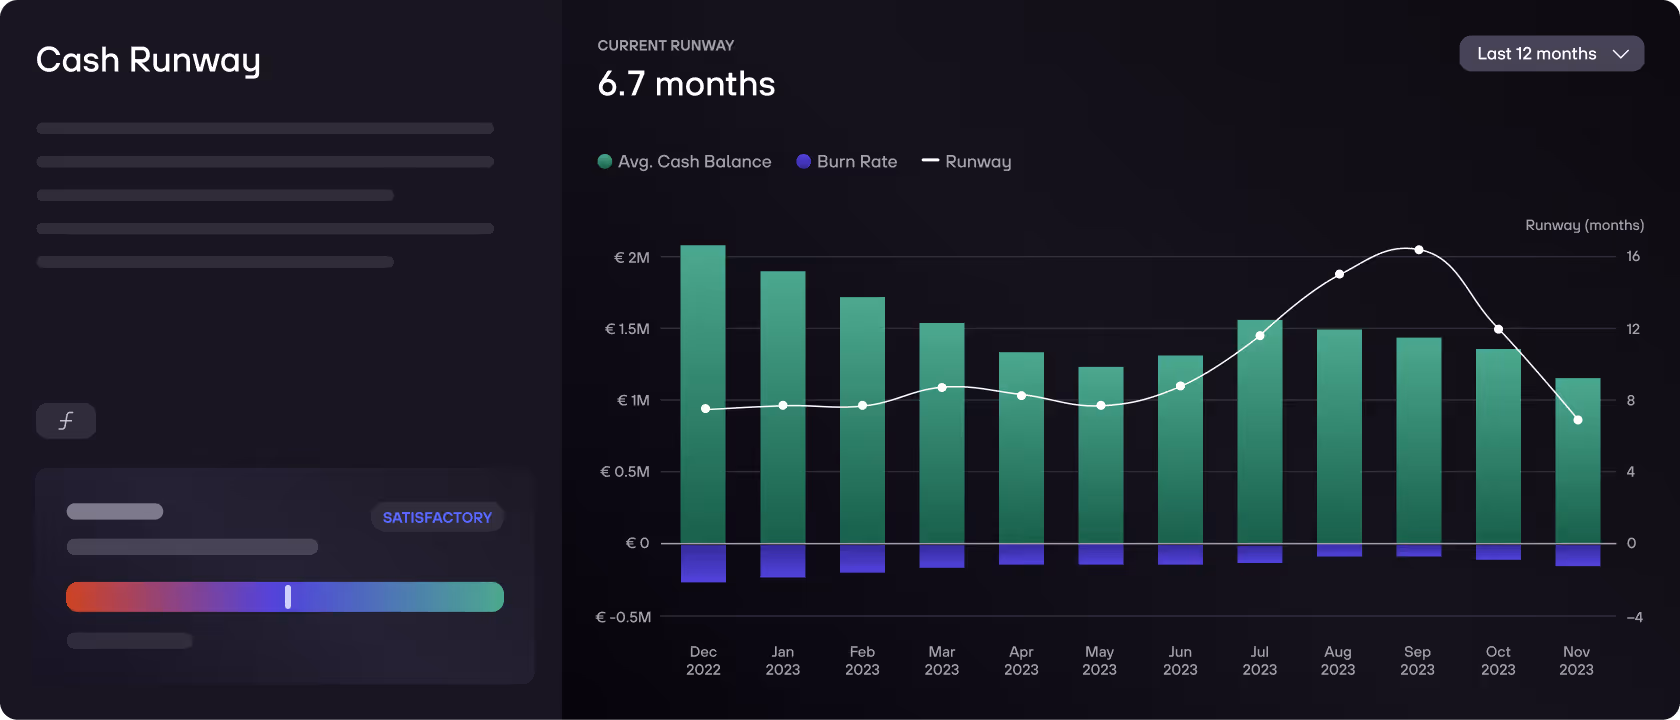
Burn Multiple and Cash Runway
Most early-stage SaaS companies burn money to grow their business. However, in recent months growth at all costs was replaced by focusing on capital efficiency and long-term profitability.
The Burn Multiple has become even more crucial to SaaS businesses. It measures capital efficiency and indicates how much capital a startup is burning to generate revenue.
The Burn Multiple is reflected in the cash runway. It's the amount of time a business has before it runs out of cash. For companies growing through VCs, it’s a crucial metric that shows the number of months they have left before their cash balance hits €0.
Example calculation Burn Multiple
The Burn Multiple is more precise than the Burn Rate because it shows how efficiently a company can generate revenue by deploying the capital they’ve raised.
The KPI is calculated by dividing net burn by net new ARR.
For example, if a SaaS company has a net burn of €1m and a net new ARR of €400k the Burn Multiple is 2,5x.
Example calculation of Cash Runway
The Cash Runway is calculated by Total Cash / Average Net Burn.
For example, if a SaaS company has €10m in the bank and burned an average of €750,000 in the last three months the Cash Runway is 13,3 months.
How to read the Burn Multiple & Cash Runway
The higher the Burn Multiple, the more the company burns money to achieve growth. The lower the Burn Multiple, the more efficient the growth is.
For fast-growing SaaS businesses, a Burn Multiple of less than one is outstanding yet anything less than two is still considered good.
Alongside the Burn Multiple, SaaS companies should focus on their Cash Runway. There is no right or wrong answer when it comes to the question of how much runway a company needs. It's highly dependent on their stage and goals.
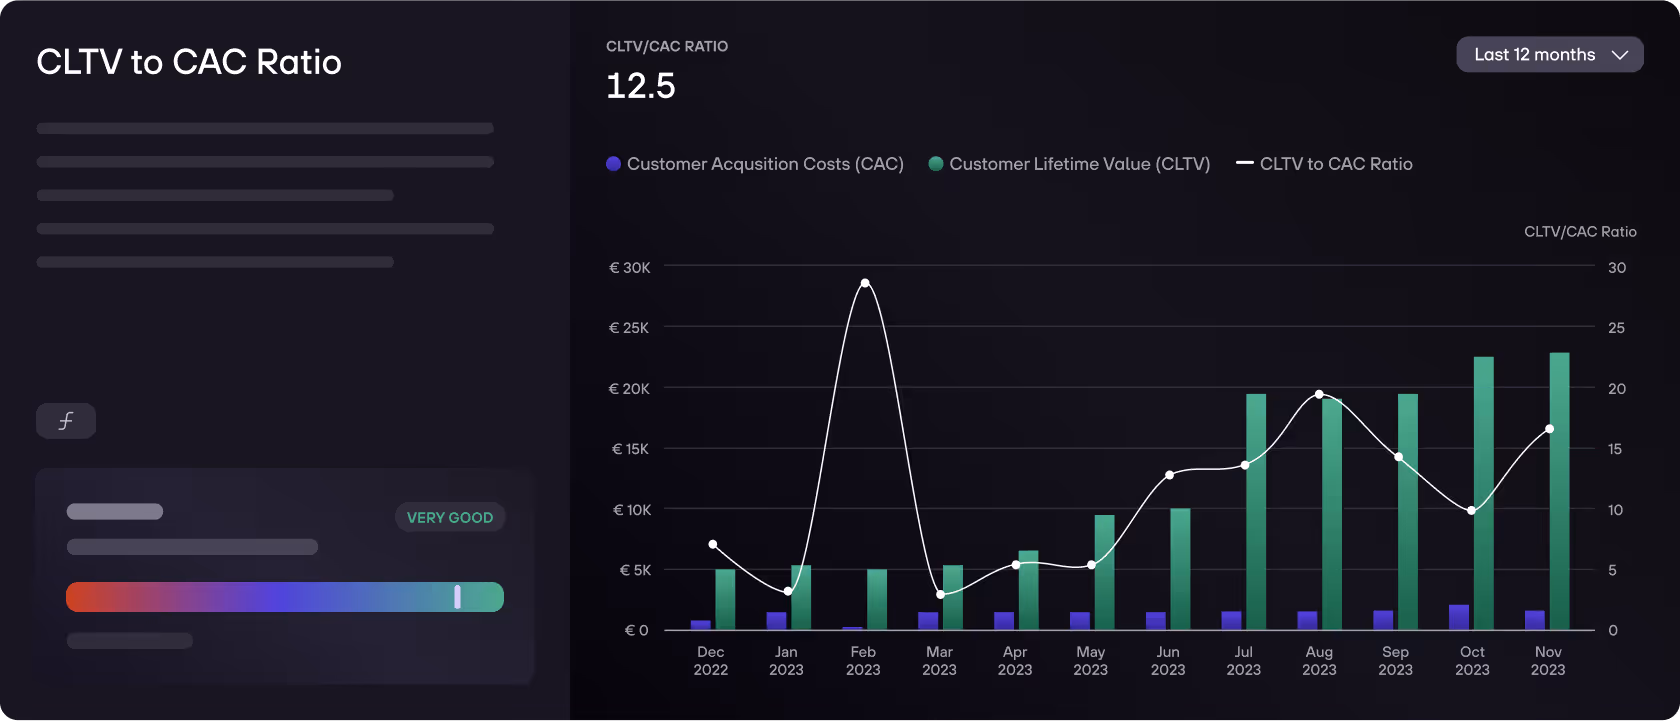
CLTV-to-CAC ratio
The Customer Lifetime Value to Customer Acquisition Cost ratio is used to assess the efficiency and sustainability of a SaaS company’s customer acquisition and retention strategies.
It evaluates the relationship between the total cost of acquiring a customer and the value that this customer is expected to generate over their entire lifecycle with the company.
In other words: if a company is overspending on acquisitions or not.
Example calculation CLTV-to-CAC ratio
The CLTV-to-CAC ratio is calculated by dividing the CLTV by the CAC.
For example, if your CLTV is €120 and your CAC is €40 then your ratio is 3.
How to read the CLTV-to-CAC ratio
A ratio of 3 is considered to be a good CLTV-to-CAC ratio for SaaS businesses. It indicates that your customer's value is three times more than the cost of acquisition. However, a customer is already profitable to a company if the CLTV-to-CAC ratio is above 1.
If the CAC is higher than the CLTV, a company should first review the acquisition process and align the costs with its strategy. In this way, SaaS companies can sustain efficient acquisition efforts in the long run.
What are the SaaS metrics you need to know about financial health?
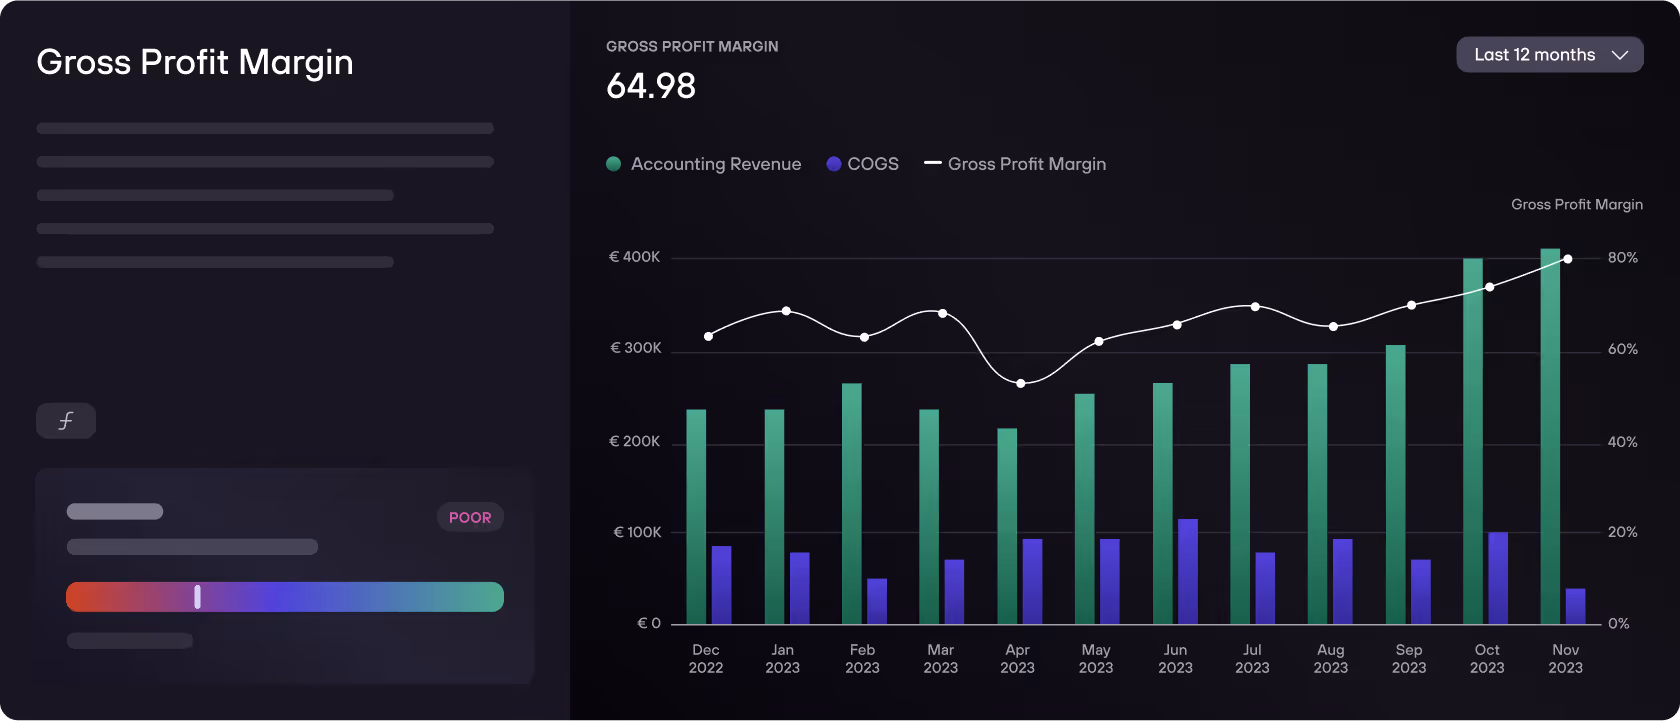
Gross Profit Margin
Gross Profit Margin shows the profitability of a business. It takes into account the profit after removing all direct costs (Cost of Goods Sold, COGS), which occur to get a product out into the market.
This SaaS metric answers the question: How much money can a company keep for every Euro they bring in?
Example calculation Gross Profit Margin
Gross Profit Margin is calculated by subtracting COGS from the total revenue, dividing the results by the total revenue, and then multiplying by 100.
For example, a gross profit margin of 80% means that a company keeps 80 cents for every Euro, while 20 cents is spent on the product.
How to read Gross Profit Margin
A low Gross Profit Margin can indicate that a SaaS company needs to cut its product spending or rethink its pricing strategy. A high Gross Profit Margin, on the other hand, can be a signal for expansion or to reinvest in the company.
75% is considered a good Gross Profit Margin for SaaS. Yet, anything below 70% can raise concerns among investors and analysts when it comes to funding topics.
For SaaS, the Gross Profit Margin is crucial to evaluate profitability and financial health. Due to the low marginal costs to sell software, it’s an indication of how effective a SaaS business can deliver its solutions to customers. Therefore, stability in Gross Profit Margins illustrates product-market fit.
SaaS metrics indicating efficient growth are crucial
2022 saw the end of a rally with a lot of venture capital in the market. Many SaaS and tech startups raised huge sums of money based on the promise of exceptional growth and future revenue. Efficiency, or in other words, a return on investment within a predictable time frame, was secondary.
Today, this has changed fundamentally. And so has the set of SaaS metrics, which investors and companies look at.
Many of these "new" SaaS metrics indicate whether a company can grow efficiently. SaaS, and tech companies in general, are now hitting the road to profitability sooner. Taking into account efficiency-driven metrics helps them along the way.
SaaS metrics and re:cap
At re:cap, SaaS KPIs are at the core of everything we do.
We know how to measure them, make them visible, and turn them into real insights. Our platform lets you track your most important metrics in real time, powered by your financial data.
Summary: SaaS metrics
SaaS metrics are essential KPIs that help measure the health, growth, and efficiency of subscription-based software businesses.
Core metrics like MRR Growth Rate, Customer Concentration, Net Dollar Retention, and Churn Cohort Analysis reveal how well a SaaS company is acquiring, retaining, and monetizing customers.
Efficiency-focused metrics (Burn Multiple, Cash Runway, and the CLTV-to-CAC ratio) show how sustainably a company is growing. Meanwhile, Gross Profit Margin provides insight into financial health and scalability.
Choosing the right metrics depends on a company’s stage and goals. While early-stage, loss-making companies prioritize growth, profitable ones focus on efficiency. In today’s environment, investors increasingly expect SaaS businesses to demonstrate sustainable growth.
Q&A: SaaS metrics
What is the 3 3 2 2 2 rule of SaaS?
The 3 3 2 2 2 rule is a revenue growth benchmark for early-stage SaaS companies.
It suggests you should triple ARR in year one, triple it again in year two, then double it in years three, four, and five.
For example, starting from €1M ARR: year one reaches €3M, year two hits €9M, year three gets to €18M, year four climbs to €36M, and year five achieves €72M. This trajectory demonstrates the kind of explosive yet sustainable growth that attracts venture capital. However, very few companies actually hit this benchmark. Focus on consistent growth that matches your capital efficiency goals rather than forcing yourself into an arbitrary growth pattern.
What is the rule of 40 in SaaS metrics?
The Rule of 40 states that a SaaS company's revenue growth rate plus its profit margin should equal at least 40%.
It's calculated as: Revenue Growth Rate (%) + Profit Margin (%) ≥ 40%.
For example, a company growing at 50% with a -10% profit margin hits exactly 40%. Another company growing at 25% with a 20% profit margin reaches 45%. The rule helps balance growth and profitability. Fast-growing companies can afford to burn cash, while slower-growing ones need stronger margins. It's particularly useful for late-stage companies deciding whether to prioritize expansion or efficiency. Companies exceeding 40% are generally considered healthy and attractive to investors.
What is SaaS benchmark?
A SaaS benchmark is a reference point or average metric from similar companies, used to evaluate how your performance compares across areas like churn, CAC, LTV, or ARR growth. You can go and check your benchmarks on our benchmarking page.
How do you evaluate a SaaS business?
You evaluate a SaaS business by analyzing its key metrics in context. Start with growth metrics (MRR, ARR, growth rate) to understand momentum. Then examine unit economics (CAC, LTV, CAC payback) to assess profitability potential. Check retention metrics (churn, NDR) to gauge product-market fit. Finally, review efficiency indicators (burn multiple, Rule of 40, gross margin) to determine sustainability.
The evaluation framework changes based on company stage: early-stage investors prioritize growth and retention, while later-stage investors demand proven unit economics and a path to profitability. Always compare metrics against relevant benchmarks and track trends over time: A single month's numbers tell you far less than six months of consistent data.
How often should you review SaaS metrics?
Review cadence depends on the metric and your stage. Cash runway and burn rate need weekly monitoring for early-stage, cash-constrained companies. MRR, customer count, and basic churn should be reviewed monthly during your financial close. Deeper metrics like cohort analysis, NDR, and CAC payback can be quarterly, giving you enough data to spot meaningful trends.
Growth-stage companies often build weekly metric dashboards but do comprehensive analysis monthly or quarterly. The key is consistency: pick a cadence and stick to it so you can spot changes early. Avoid the trap of checking metrics constantly without taking action; data without decisions is just noise.
What's the difference between gross churn and net churn?
Gross churn measures pure customer or revenue loss without accounting for expansion. Gross customer churn is the percentage of customers who canceled. Gross revenue churn is the MRR lost from cancellations and downgrades. Net churn (or net revenue retention) factors in expansion revenue from existing customers through upgrades, cross-sells, or usage increases.
You can have 10% gross revenue churn but -5% net churn if expansion revenue exceeds losses. Gross churn shows the leak in your bucket; net churn shows whether you're filling it faster than it's leaking. Both matter: high gross churn signals product or service issues even if expansion masks it in net numbers.
Why do SaaS companies focus so much on retention instead of new sales?
Because existing customers are dramatically cheaper to monetize than new ones. Acquiring a new customer costs 5-25 times more than retaining or expanding an existing one. In subscription businesses, most revenue comes from renewals and expansions, not initial sales.
A SaaS company with 90% retention compounds its customer base; one with 70% retention loses ground despite constant new sales. This is why NDR over 100% is so valuable, you grow revenue without acquiring a single new customer. Poor retention also signals product-market fit problems that will eventually stall all growth. Fix retention first, then scale acquisition. Otherwise you're pouring water into a leaky bucket.
What's a healthy CAC payback period for SaaS companies?
Most investors expect CAC payback within 12 months, though 12-18 months is acceptable for businesses with strong unit economics and long customer lifetimes. Enterprise SaaS companies with multi-year contracts can sustain longer payback periods because LTV is higher and churn is lower.
Conversely, SMB-focused products need faster payback (6-12 months) because churn tends to be higher. Calculate CAC payback as: CAC ÷ (ARPU × Gross Margin %) = months to payback. If you're burning cash, shortening CAC payback is one of the fastest ways to extend runway. The faster you recover acquisition costs, the more efficiently you can reinvest in growth.
How do you know if your churn rate is actually a problem?
Context determines whether churn is problematic.
For SMB SaaS, 3-7% monthly churn is typical but still concerning. For mid-market, 1-2% monthly is normal. Enterprise SaaS should see less than 1% monthly churn.
Annual churn follows similar patterns: SMB (40-70%), mid-market (10-25%), enterprise (5-10%). But raw churn percentages don't tell the full story. If your NDR is 110%+ despite 5% customer churn, expansion is compensating. If churn concentrates in your first 90 days, you have an onboarding problem. If it spikes in specific cohorts, you had a product or sales issue when they signed up. Segment your churn by customer age, size, and acquisition channel to find the real problems.
How do you improve poor SaaS metrics without killing growth?
Start by diagnosing the root cause:
- Poor retention? Fix onboarding and customer success before spending more on acquisition.
- High CAC? Optimize your most efficient acquisition channels and pause or fix underperforming ones.
- Low gross margin? Examine infrastructure costs and pricing, you might be undercharging or over-provisioning resources.
- Weak NDR? Build expansion revenue through additional products, usage-based pricing, or clear upgrade paths.
The key is addressing problems sequentially, not simultaneously. Fixing everything at once creates chaos and obscures what's actually working. Pick your biggest constraint, fix it over 2-3 months while maintaining growth discipline, measure the impact, then move to the next issue. Sustainable improvement beats aggressive pivoting.
Compare yourself against competitors
We build a benchmarking tool with which you can compare your company to 4,000+ SaaS companies – for free!
See your benchmarks.png)

