.gif)


There is no single road to profitability for SME SaaS. We work with the live banking data of tech companies across Europe, so we watch cash move month by month instead of reading it off a quarterly deck. Look across the companies that reach breakeven, and the same few shapes keep showing up.
This piece describes three of them. They are not the only ways a company can get there, and they are not a survey of the whole market. They are patterns we see repeatedly in the cash of companies that made it, sharpened into recognisable types so you can tell which one is yours.
That matters because each path has a different risk and needs a different kind of capital planning. Companies rarely die from the burn but rather from reaching for funding once the tank is already low.
What you'll learn in this article
- Three patterns we see in how SME SaaS companies reach profitability, drawn from historic and live re:cap cash data
- The specific risk that comes with each path, and the one thing you have to get right on it
- Why heavy burn is not always the warning sign people think it is
- How to decide which path is yours, and line up the capital it needs before you are deep into it
TL;DR
- Reaching profitability while growing is real for SME SaaS, and the path there is rarely a straight line. In live cash data, a few recognisable shapes keep showing up.
- One is a slow grind, where burn narrows quarter after quarter until it crosses zero. One is a seasonal sawtooth, where annual billing swings the account from flush to thin and back. One is an investment curve, where burn deepens on purpose to fund growth before it turns.
- Many companies are a blend, and they move between shapes over time. The early chapter of one can be the endgame of another.
- The lesson is to work out which shape fits your business early, while you still have room to act. Each path runs out of cash in a different place and needs a different kind of funding. Plan it well in advance, because the moment you are close to the turn and low on cash is the moment funding gets hardest to secure.
Get funding without giving up equity
Find out if your company is ready for debt financing in 60 seconds
Check fundability nowWhy the bank account, not the P&L
A profit and loss statement accrues, smooths, and lags. The bank account records what happened to the money, and when.
That timing is the whole story here. The same word, profitability, hides very different realities in the cash. A company can look profitable on an annual P&L while its bank balance swings from flush to nearly empty and back every year. Another can look like it is still burning while it is two months from a clean, permanent turn. You can only tell them apart by watching the cash itself.
So the shapes below come from real operating cash flow through real accounts, not from self-reported figures. The numbers are of course aggregated and anonymised.
Path 1: The Grind
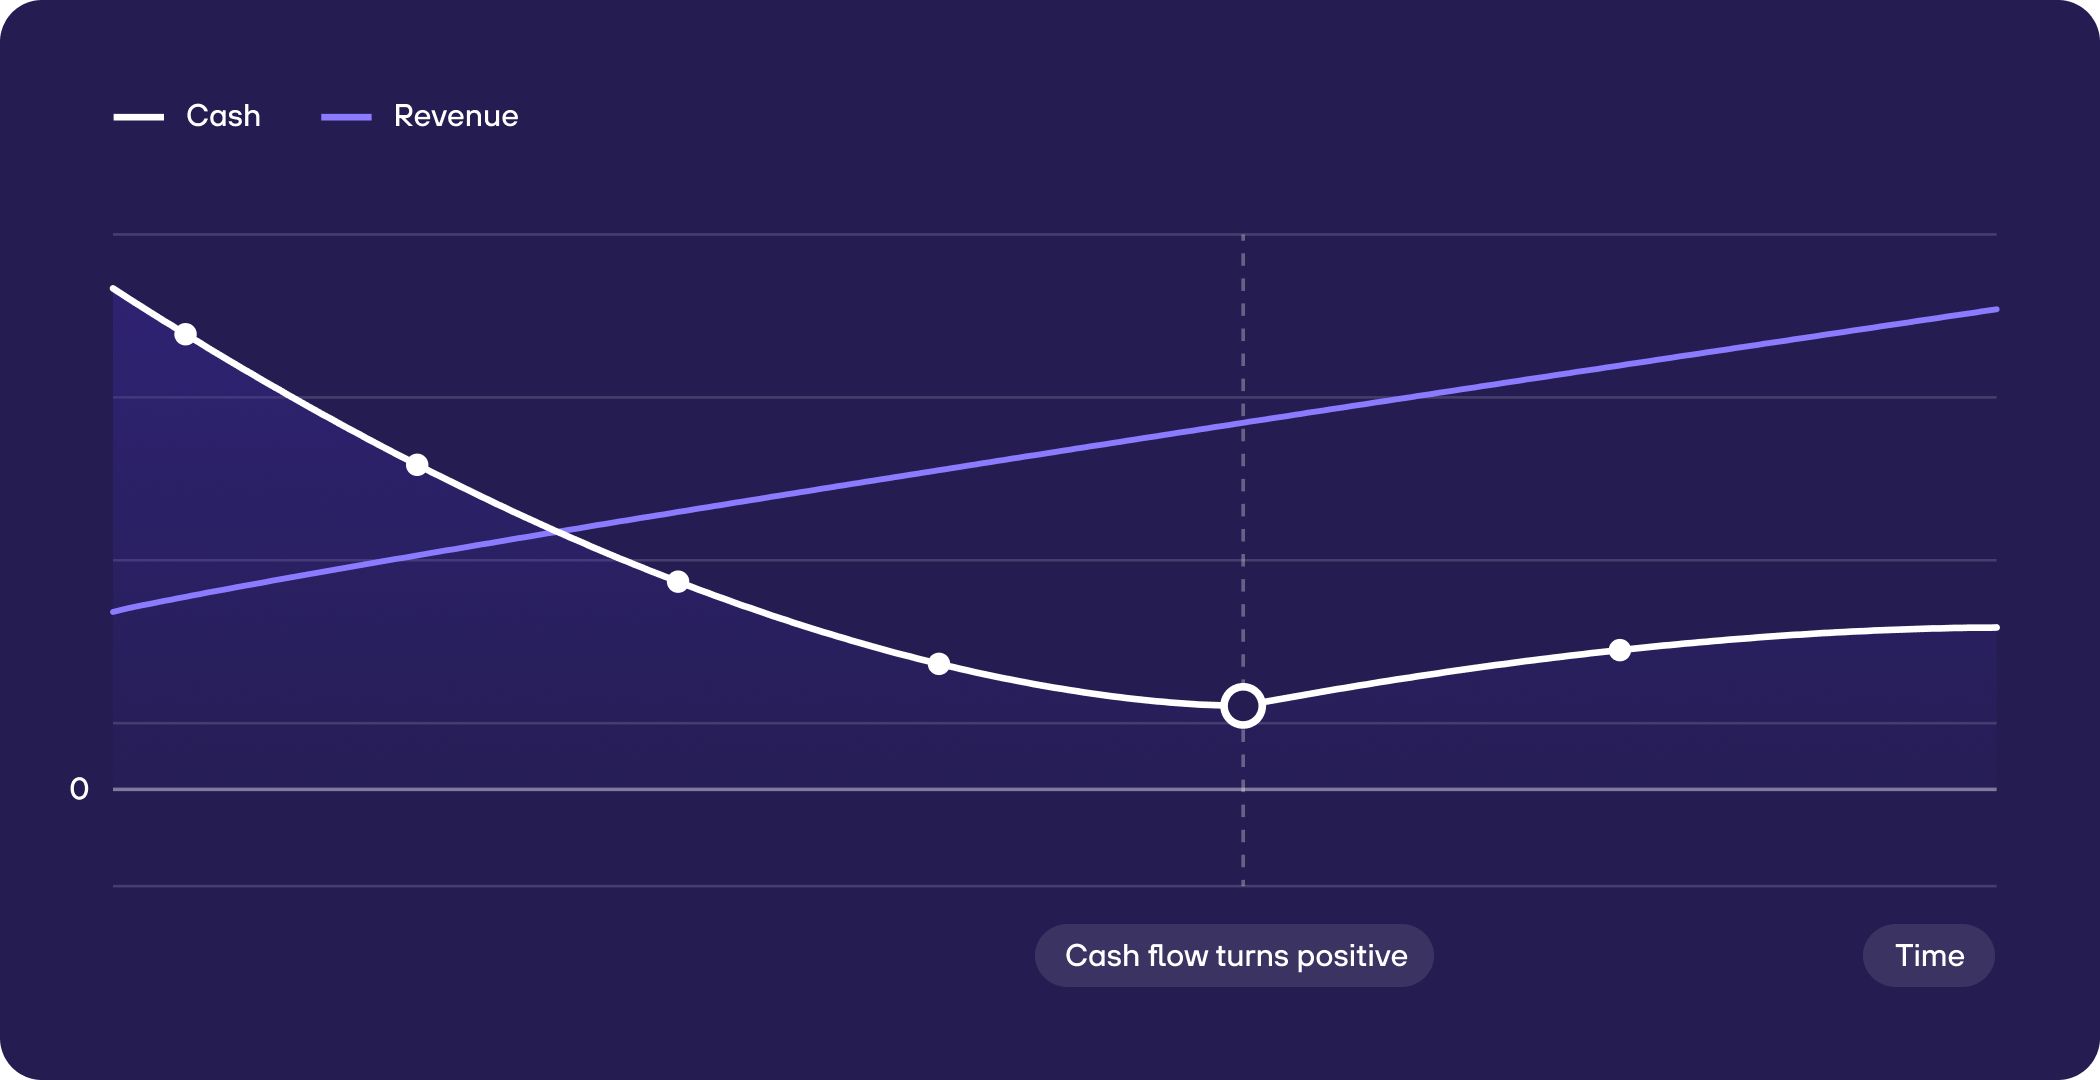
Let’s start with the first one, the Grind, as it is the one most founders picture. Revenue climbs while the cost base holds roughly flat, so monthly burn narrows quarter after quarter until it crosses zero. It is slow, it is undramatic, and it works.
We see it clearly in the data. One company narrowed its burn steadily for about eighteen months and crossed into positive cash flow while its revenue grew 27% over the year. Another grew 45% while more than halving its monthly burn on the way to the turn.
While the burn itself might not be the biggest risk on the Grind, there is one thing to watch: the timing of the cash low. The company burns cash right up to the turn, so its balance is thinnest exactly when it is about to cross into profit. Across the companies we watched make this crossing, the cash low lands right at the turn, in the thinnest cases down to a matter of weeks of runway. They crossed because they saw the low point coming. That foresight is the whole difference.
That is where good businesses die, one quarter short of their own breakeven. So the thing you have to get right on the Grind is the low point. Model where your buffer is thinnest before you reach it, and arrange the capital to cross it while your numbers still look calm. Founders are ambitious by nature, and a little optimistic. That optimism tends to produce a single, confident breakeven date. Model more than one. Run a best case and a worst case, and make sure you hold enough capital to survive each of them. The scenario you did not plan for is the one that catches you.
A lender says yes to a company that is three quarters from breakeven with a clear trend. It says no to the same company one month from breakeven with three weeks of cash left. Same business, worse timing.
Path 2: The Sawtooth
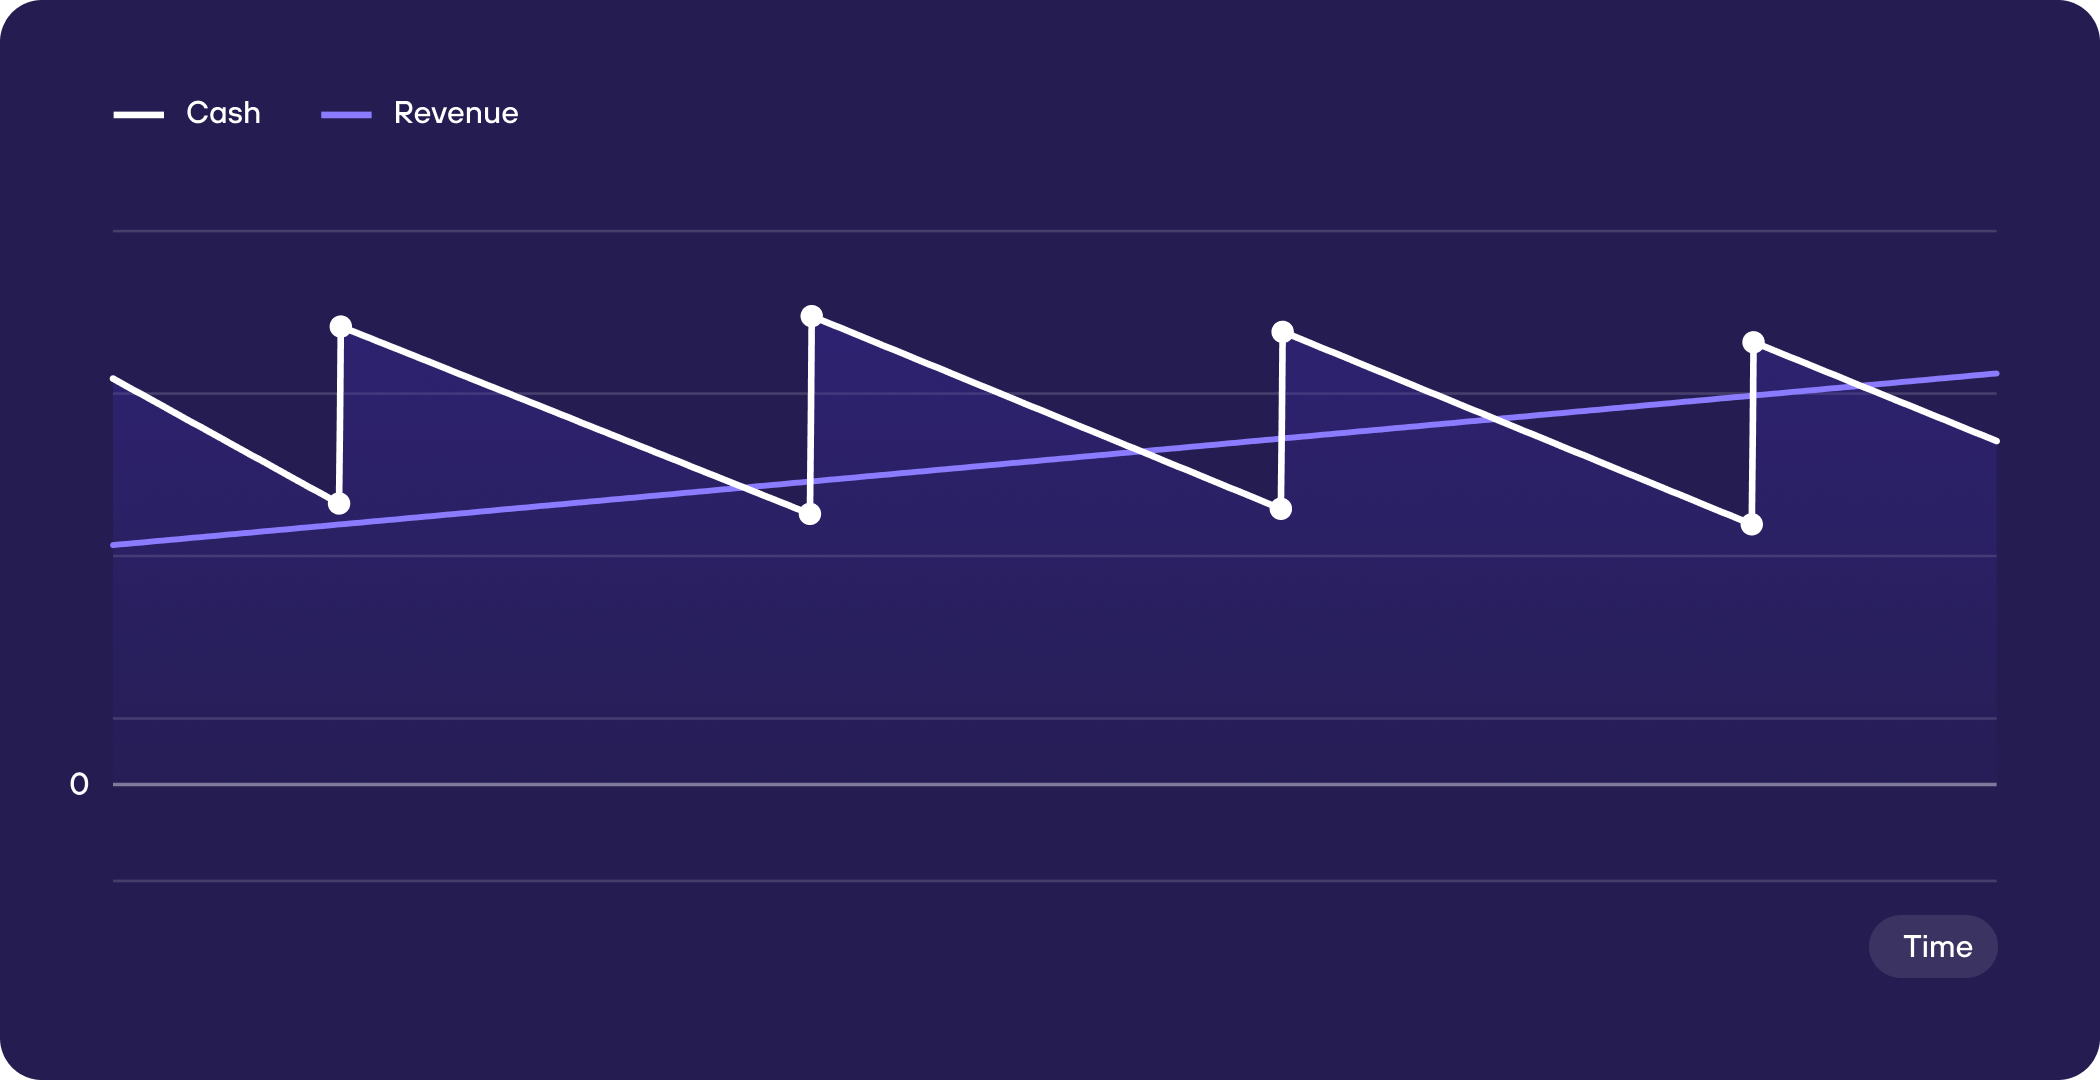
The Sawtooth belongs to companies with heavy annual billing. Cash floods in when contracts renew, then drains for the rest of the year. On a monthly view the company looks unprofitable most of the time. On an annual view it is fine. Neither view alone tells the truth.
In the data these companies swing hard. A single deep-burn month can be followed by a renewal month that more than reverses it, and the cash balance travels from nearly full to a fraction of that and back inside a year. The pattern repeats every twelve months.
Underneath the swing, recognised revenue is fairly smooth. The sawtooth comes from billing and collection timing. Demand itself is steady, and the business underneath is calmer than the bank balance makes it look.
That is why the frame comes first. Judge the business on a trailing twelve-month basis. A strong renewal month reflects the billing calendar, so reading it as a breakthrough leads you to overspend. A thin summer reflects the same calendar, so reading it as decline leads you to cut the wrong things.
The companies that manage this well share three habits.
First, they size the buffer to the trough rather than the average. The dangerous month is the one furthest from a renewal, after cash has drained for two or three quarters. Companies that ride the Sawtooth comfortably hold enough to clear that low point with room to spare. The ones that get caught size their cash to a normal month and reach the trough nearly empty.
Second, they treat renewal cash as runway rather than profit. A full account right after a billing cycle is most of next year's operating budget arriving at once. Ramping costs against that inflow is how a calendar swing becomes a real cash problem.
Third, they know when their own trough falls and arrange liquidity for it in advance. The renewal cash is long gone by the time the drought hits. Capital for the trough only helps if you line it up before you are standing in it.
The Sawtooth is rarely in real danger. It punishes the founders who read a good month as progress, spend into it, and forget how long the winter runs.
Path 3: The Investment Curve
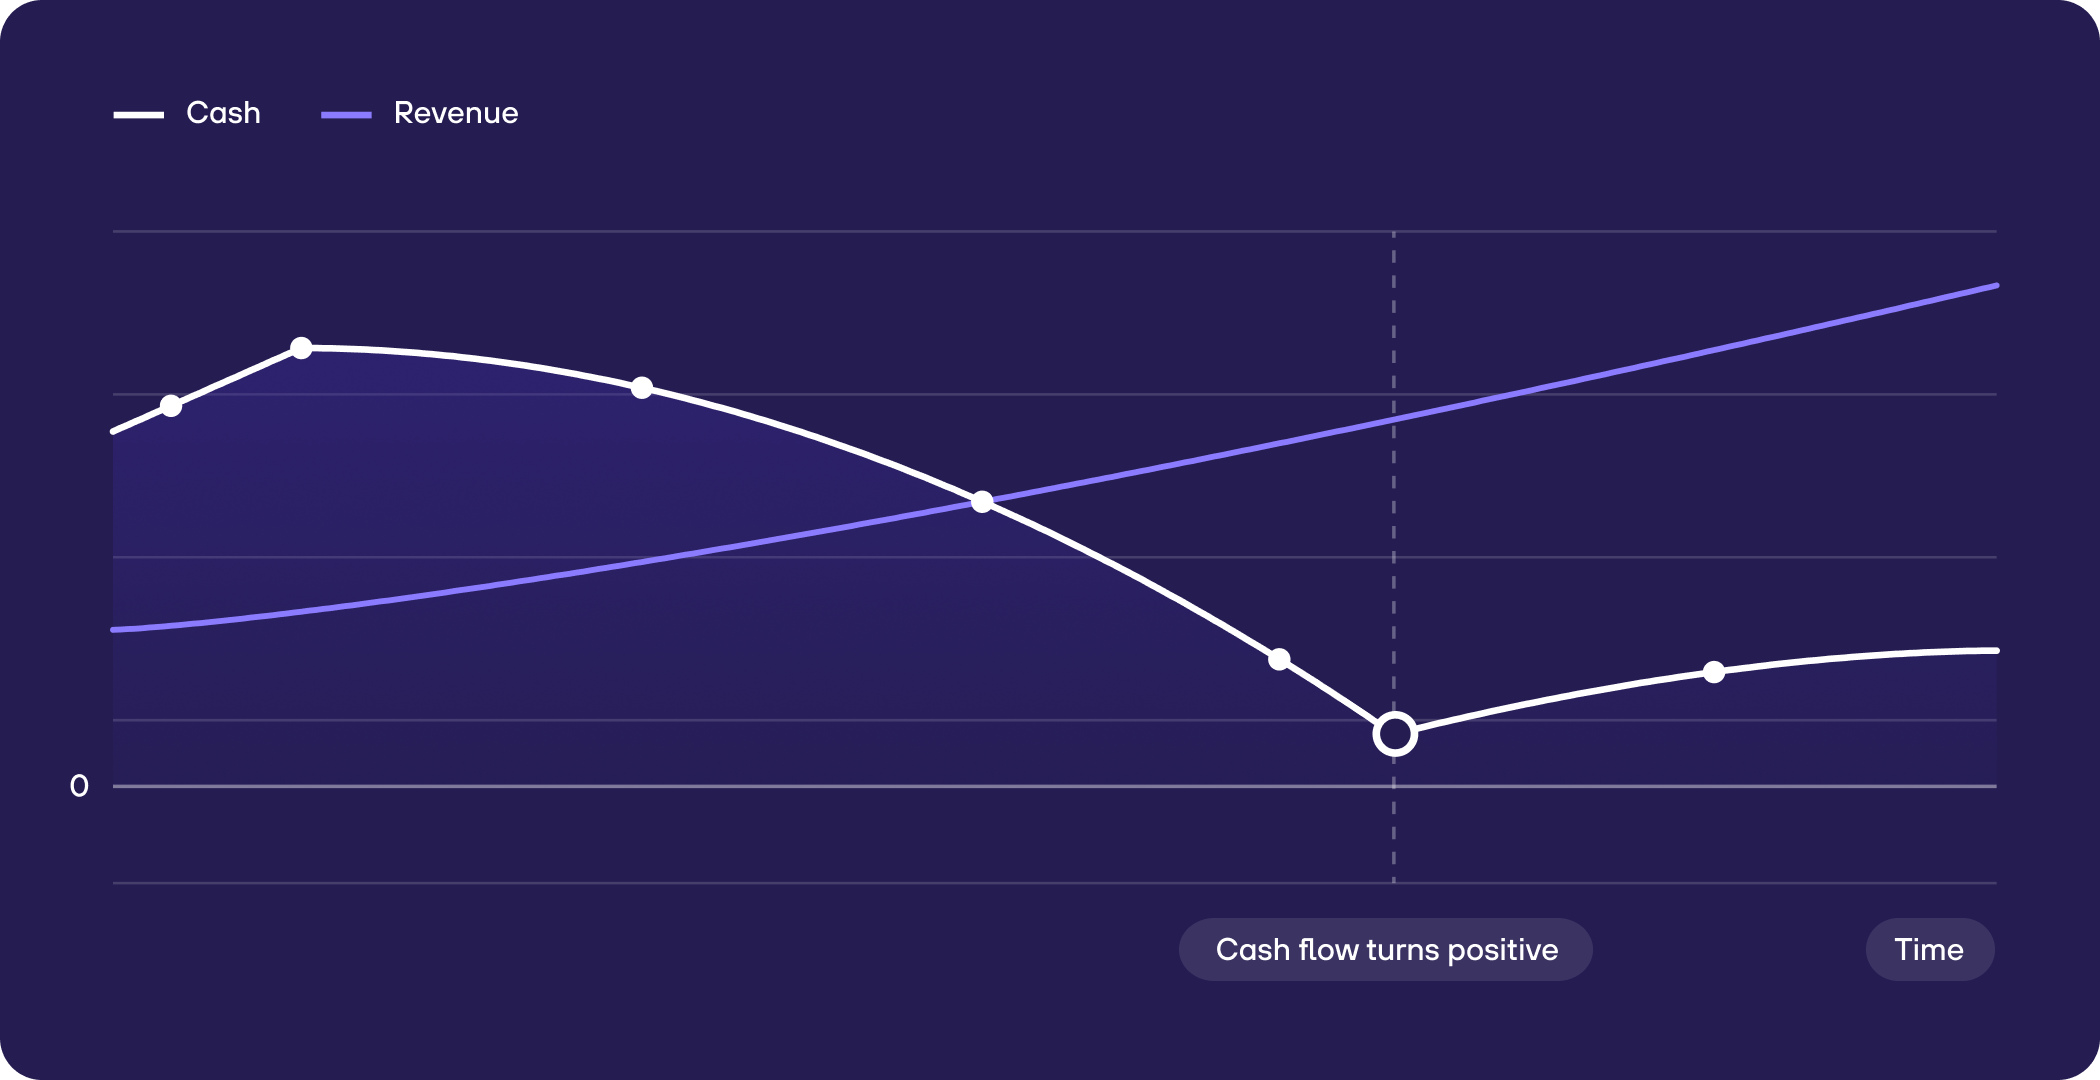
On the Investment Curve, burn deepens on purpose. The company raises or earns capital and puts it straight back into growth, so the worst burn comes in the middle of the journey, not the start. Revenue compounds, and the cost base is allowed to grow with it until the two lines meet later.
We see this shape often. One company grew revenue more than 100% in a year while its burn widened, not narrowed. Two others raised fresh capital and, within a month or two, pushed monthly burn sharply deeper to fund the next leg of growth. That is a deliberate choice.
The risk is that the shape looks identical to a company in trouble, right up until it doesn't. Deepening burn is healthy while it is buying growth that will outpace the cost base. It is dangerous the moment growth flattens and burn keeps climbing. From a single month you cannot tell the two apart.
So the thing you have to get right is the efficiency of the burn, watched over time. The question is simple: how much durable new revenue does each euro of burn buy? Some call this the burn multiple, your net burn divided by the net new revenue it produces. While that ratio holds or improves as you spend more, the curve is working. When it takes more and more burn to add the same revenue, the gap is closing the wrong way. That shows over two or three quarters, not in one month.
This tells you where to put the money. Deepen burn into what has already shown a repeatable return, a channel with a known payback, a segment that reliably expands. Experiments still belong here. Fund them from a fixed, bounded budget, make each one prove its economics while it is still small, and let only the winners graduate into the deeper burn. You are scaling what works and paying a set price to keep finding more of it. What breaks companies on this path is deepening burn across the board on faith.
The harder question is when to stop. Two triggers should end the deepening. The first is efficiency: if each euro of burn buys less growth for two or three quarters running, stop widening. The second is distance: always know how much cash and how many months it would take to reach breakeven at today's burn and growth, and whether you hold that much with a margin on top. When the capital required to reach the line grows faster than the capital you can raise or afford, the deepening is over.
You will not always catch the turn in time. If growth has flattened while burn stayed high, and your runway to breakeven no longer fits your cash and realistic funding, you have missed it. Cash getting thin while growth is flat is the late signal, and by then your options are narrower.
What you do then is switch paths on purpose. Cut back to the efficient core, shrink the unproven bets, and let revenue start grinding the burn back toward the line. The Investment Curve, matured or corrected, becomes the Grind. The same rule applies at that seam: arrange the capital to cross while your numbers still look calm, because the moment you are flat on growth and low on cash is the moment funding gets hardest to secure.
The paths overlap, and that is fine
Real companies move between these shapes. The Investment Curve is often the early chapter and the Grind is the endgame: a company spends deep to build, then lets revenue grind the burn back down to the line. Two of the companies we looked at did exactly that. A Sawtooth business can also be grinding its annual average toward zero underneath the swings.
You do not need to file yourself in one box forever. What matters is knowing which shape you are in right now, because that determines where your cash gets tight and what kind of funding fits.
Think about your path before you are on it
Each of these paths needs a different capital plan, and each one punishes founders who wait.
Decide which shape your business is in. Do you have heavy seasonal billing, or a smooth monthly base? Are you grinding burn down, or spending into growth on purpose? Then match the funding to the path. The Grind needs a bridge sized to the low point, arranged early. The Sawtooth needs liquidity structured around the billing calendar. The Investment Curve needs capital that funds the deepening while you still have a clear line to breakeven.
The common failure is the same across all three. You look at your cash only when it is already tight, and by then your options have narrowed to the worst ones. The best time to arrange capital is while the numbers still look comfortable, because that is exactly when you have the standing to get it on good terms.
Watch the cash, name your path, and plan the funding for it in advance. That is the difference between reaching profitability and running out one quarter short of it.
FAQ – Questions founders ask about the path to profitability
What data is this based on?
Live banking and billing data from several European B2B SaaS companies between roughly €1M and €20M ARR that work with re:cap. We measured operating cash flow through their real accounts over two years, rather than self-reported P&L figures. Everything here is aggregated, with no individual company identified.
Are these the only ways to reach profitability?
No. These are three shapes we see repeatedly on our own platform, sharpened so they are easy to recognise. They are not exhaustive and not a market survey. Your path may be a blend of them, or something else entirely.
Isn't this survivorship bias?
Partly, and we say so plainly. We are describing companies that are active and moving toward or through breakeven, so the sample leans healthy. Read it as what the paths look like when they work, not as a claim about every SaaS SME.
Is a high burn rate a bad sign?
Not on its own. On the Investment Curve, deepening burn is a deliberate bet on growth, and several of the strongest companies in our data burned hard on the way up. What matters is whether burn is buying growth that outpaces the cost base, watched over time rather than in a single month.
How do I know which path I'm on?
Look at the shape of your monthly operating cash flow over the past two years. Smooth narrowing toward zero is the Grind. Big regular swings tied to renewals are the Sawtooth. Widening burn alongside fast revenue growth can be the Investment Curve. If you cannot see the shape clearly, that is the first problem to fix.
When should I arrange funding?
Before the buffer gets thin. On every path, the worst time to raise is when you are close to the edge and short of cash, because that is when lenders and investors say no. Arrange the capital while the numbers still look comfortable and the trend is in your favour.
Get funding without giving up equity
Find out if your company is ready for debt financing in 60 seconds
Check fundability now