Your main goal with a long-term forecast is to plan the next months in a way that’s automated but still flexible.
To do that, you create a monthly forecast and combine:
- the automated dynamic trend (your base plan), and
- additional expected cash flows on top (one-off or exceptional items).
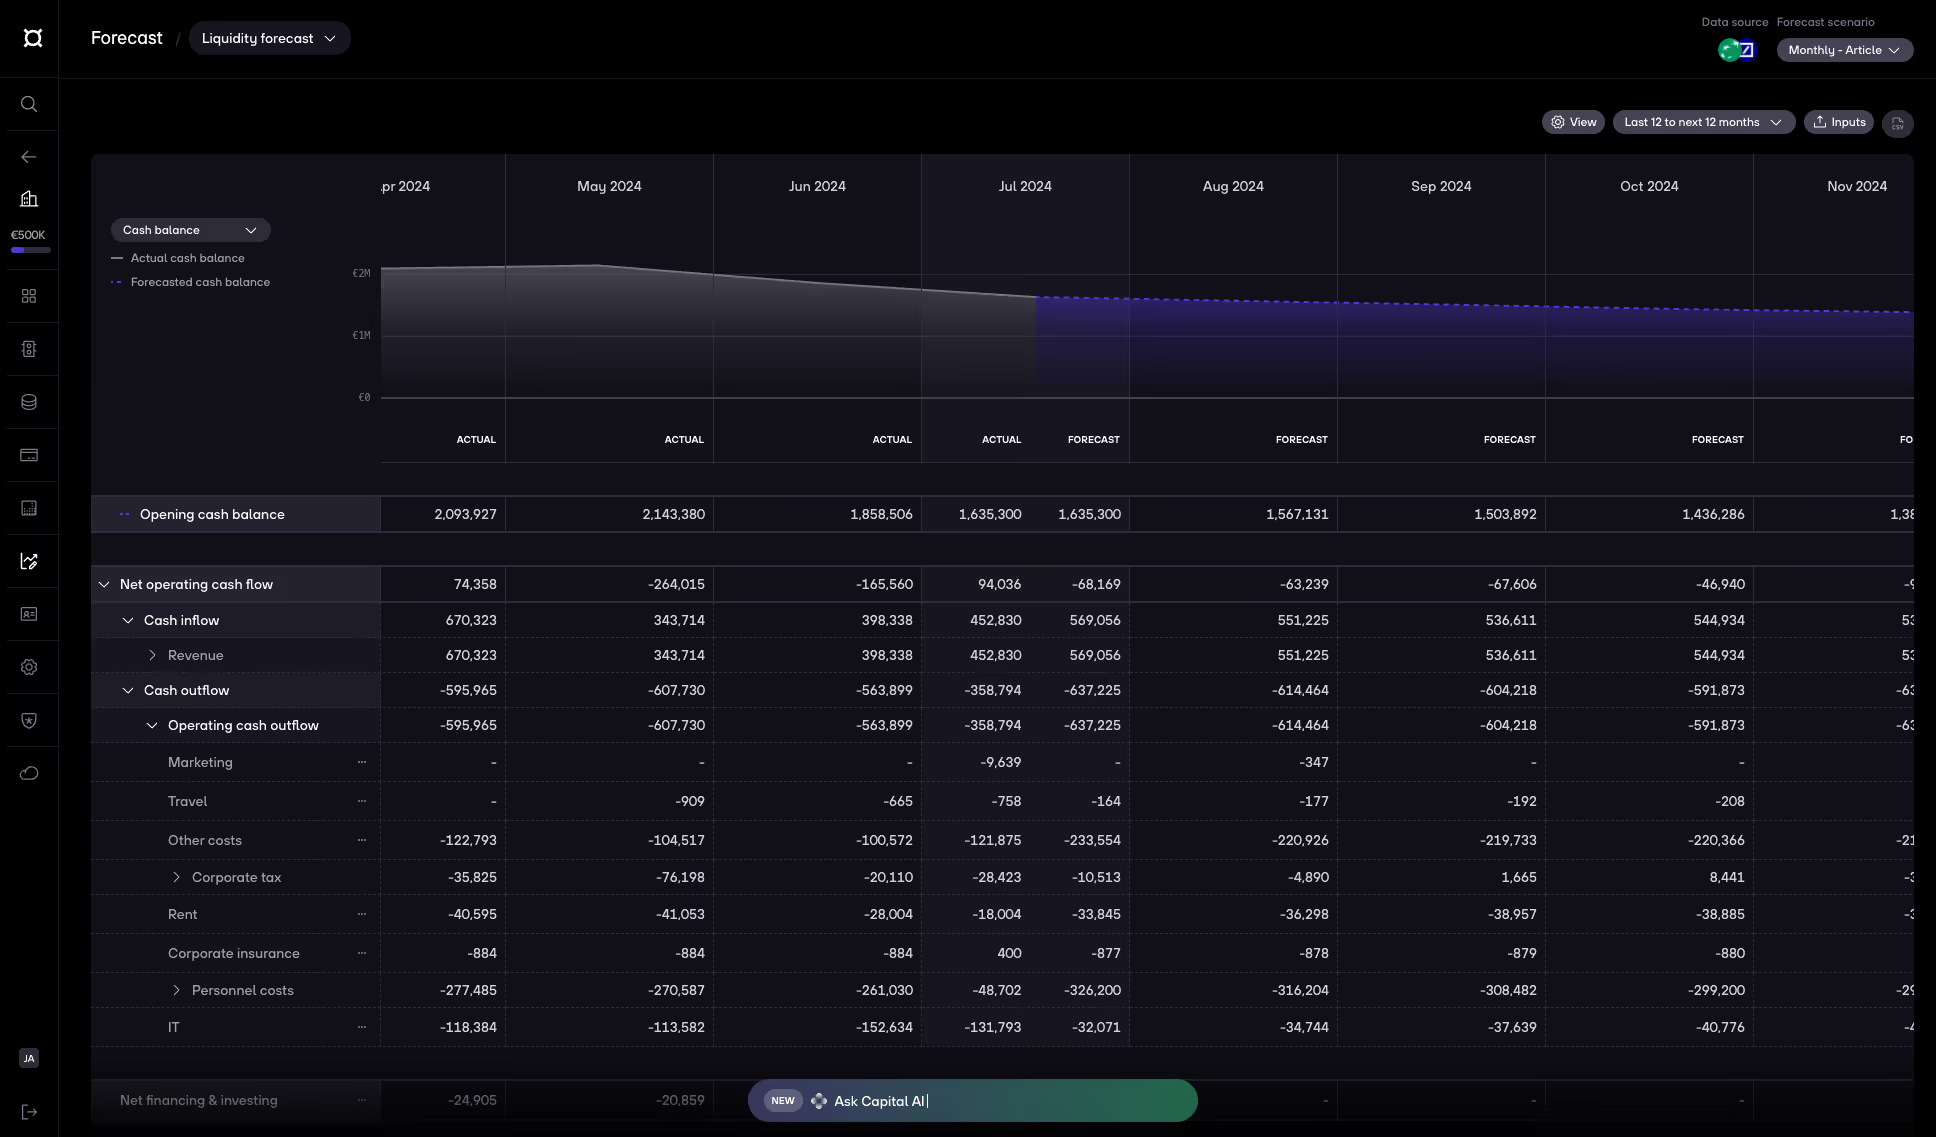
What you see when you create a monthly forecast
By default, a new monthly forecast shows:
- Last 12 months to next 12 months.
- All Actuals (bank transactions) populated up to today.
- Forecast columns already filled with values from the dynamic trend.
Check or change dynamic trend vues settings
After creating the forecast, you’ll see the dynamic trend values directly in the table for the current and future months.
If you want to review or adjust how those values are calculated, you have three options:
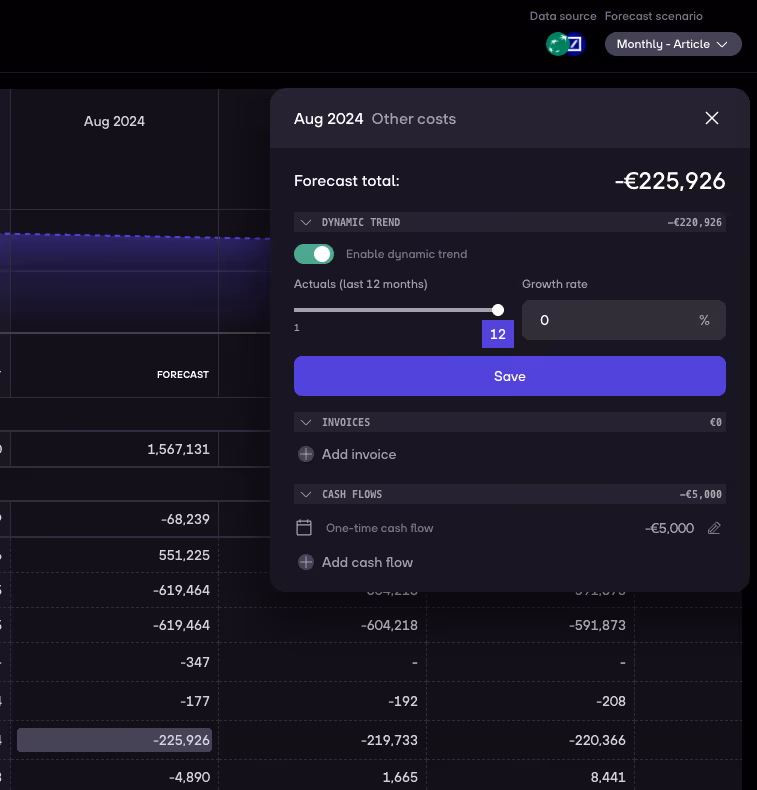
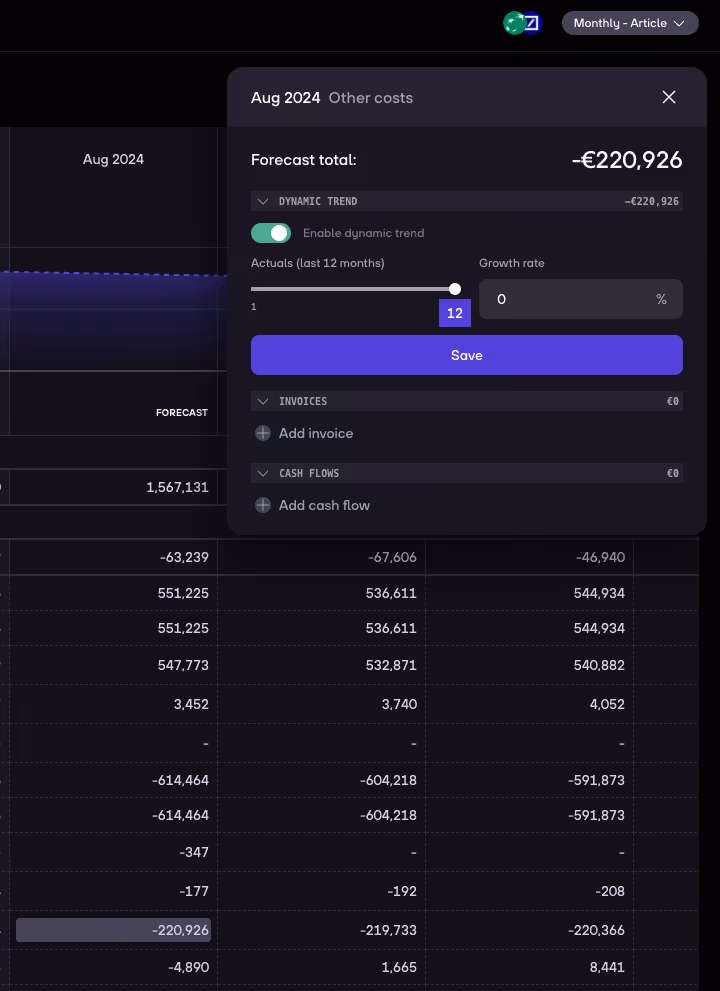
1. From a specific cell
- Click into the cell you’re interested in.
- Go to the related category (e.g. Other costs) to see or adjust the logic.
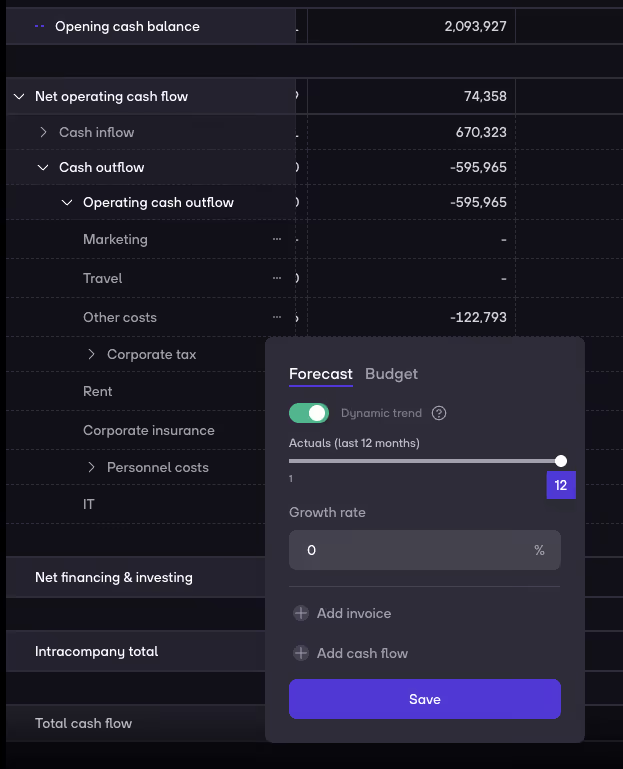
2.From a specific category
- Go to the category on the left (e.g. Other costs).
- Click … then go to Forecast and make sure Dynamic trend is enabled (or disable it if needed).
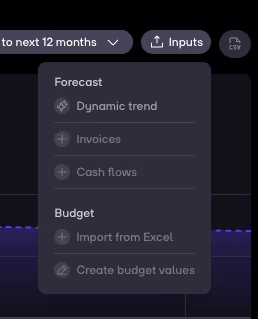
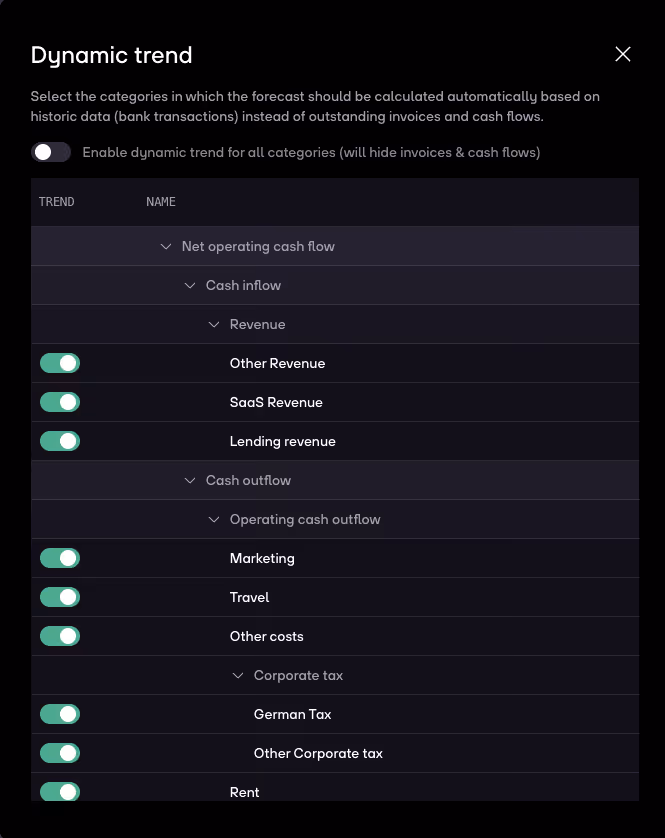
3. From Inputs to Dynamic trend overview
- Go to the top right and click Inputs.
- Open Dynamic trend to see which categories have it enabled.
- To disable dynamic trend for a category, simply switch off the toggle.
Adding cash flows on top
On top of the dynamic trend, you might want to add additional inflows or outflows above the average (e.g. future cash inflow from a grant). For that, you can use the cash flows feature.
This works the same as in the weekly forecast, explained in the weekly forecast creation.
The expected cash flow value will be added to the right cell, and thus to the Forecast total of that month.