How does analysis and optimization of capital structure differ for companies in various stages and with different business models?
Traditionally, companies with tangible assets (asset-heavy) have easier access to funding than those relying on intangible assets (asset-light). But things are changing. A shift in risk analysis and alternative financing is giving asset-light businesses more funding options.
While asset-light companies still face capital structure challenges, new risk assessments and financing solutions are making it easier. By adapting to these changes, companies can secure funding that fits their needs and navigate industry challenges more effectively.
What you'll learn in this article
- What capital structure is and how to build your capital stack with confidence
- Why new financing methods allow companies to take on debt earlier, reducing their reliance on equity
- How to calculate and optimize your own capital structure using proven frameworks
TL;DR
- A company's capital structure relies on debt (borrowed capital) or equity (selling shares) to fund its growth
- The ideal balance depends on business goals, industry dynamics, and growth stage – some thrive on debt, others on equity
- Companies adjust their capital structure based on interest rates, capital costs, and economic conditions
First, let's take a closer look at the core elements of capital structure.
Definition: What is capital structure?
The capital structure, or capital stack, describes a company's mix of equity (selling shares) and debt (borrowed money). It appears on the liability side of the balance sheet. The capital structure serves as a blueprint for how the company organizes and replenishes its financial reservoirs.
The fundamental components
Capital structure encompasses all the financing sources a company uses to fund its operations and growth. At its core, it represents the strategic decisions about how to balance two fundamentally different types of capital:
- Equity capital represents ownership in the company. When you raise equity, you're selling a piece of your business to investors who become shareholders. These investors take on significant risk: if the company fails, they may lose their entire investment. In exchange for this risk, they expect substantial returns. Equity doesn't require fixed payments, giving companies flexibility during lean periods. However, it dilutes ownership and means sharing both control and future profits.
- Debt capital is money borrowed that must be repaid with interest, regardless of how the business performs. Lenders face lower risk than equity investors because they have legal claims on company assets and get paid before shareholders if things go wrong. This lower risk means debt is cheaper, interest rates typically range from 5-25% depending on the company's creditworthiness and loan terms. Debt payments are also tax-deductible, further reducing the effective cost. The downside is the rigid repayment schedule that can strain cash flow, especially during downturns.
Why capital structure matters
A high proportion of equity generally indicates financial soundness: the assets are backed by ownership capital rather than borrowed funds. Conversely, high liabilities may signal that assets don't fully belong to the company, but to third parties like banks or bondholders.
However, this simple interpretation misses crucial nuance. In practice, evaluating capital structure requires examining multiple factors simultaneously:
- Cost of capital: What's the weighted average cost across all funding sources?
- Financial flexibility: Can the company weather downturns and seize opportunities?
- Growth stage: Early-stage companies need different structures than mature firms
- Industry dynamics: Capital-intensive businesses naturally carry more debt
- Tax efficiency: Debt's tax deductibility can significantly reduce effective costs
- Risk tolerance: How much volatility can stakeholders handle?
From their capital structure analysis, companies discern the optimizations necessary to enhance appeal to capital providers and reduce capital costs. Financial institutions and investors gauge investment risks and determine terms and conditions based on an evaluation of the capital structure.
The three-layer capital stack
The capital stack typically consists of three hierarchical layers, each with different risk-return profiles:
- Senior debt sits at the bottom of the stack and carries the lowest risk. It's secured by company assets and gets repaid first in liquidation scenarios. Banks and traditional lenders provide senior debt at relatively low interest rates. This layer forms the foundation of most capital structures for established companies.
- Subordinated debt (also called mezzanine financing) occupies the middle layer. It carries higher risk than senior debt because it gets repaid second, so lenders charge higher interest rates to compensate. Subordinated debt often includes equity kickers like warrants, giving lenders upside potential alongside their interest payments.
- Equity sits at the top of the stack with the highest risk and highest potential returns. Equity holders are the last to be paid in liquidation but benefit most from company success through appreciation and dividends. This layer includes common stock, preferred stock, and retained earnings.
Understanding this hierarchy is crucial because it determines how capital providers view risk and price their capital accordingly.
Calculation of capital structure
The capital structure is calculated using the following formula: (Equity / Debt) x 100.
It describes the vertical capital structure and compares equity and debt to the total capital of a company.
In contrast, the horizontal capital structure describes whether equity covers fixed assets and debt covers current assets.
Capital structure formula
There are specific formulas for each:
- Horizontal capital structure I = (Equity / Fixed Assets) x 100
- Horizontal capital structure II = (Debt / Current Assets) x 100
Capital structure ratio
Equity Ratio, Debt Ratio, and Debt-to-Equity Ratio: These ratios allow for a deeper analysis of a company's capital structure.
- The equity ratio is calculated as: (Equity / Total capital) x 100
- The debt ratio is calculated as: (Debt / Total capital) x 100
- The debt-to-equity ratio is calculated as: (Debt / Equity) x 100
How much funding could you get from re:cap?
Find out if your company is ready for debt financing in 60 seconds
Check fundability nowDebt vs. Equity: Understanding capital structure trade-offs
Every company must decide how to finance its operations and growth, balancing debt and equity to create an optimal capital structure. The right mix depends on various factors, including financial goals, risk tolerance, and market conditions.
However, this decision comes with trade-offs that can impact profitability, control, and financial stability.
At the heart of capital structure decisions lies the choice between debt financing and equity financing. Each option has advantages and drawbacks, and companies must weigh them carefully.
The core characteristics
The trade-off between financial stability and growth
A company's capital structure affects its ability to withstand economic downturns and seize growth opportunities.
- High debt levels can lead to financial instability but may drive higher returns if managed efficiently. Debt creates leverage, amplifying both gains and losses. When revenues exceed the cost of debt, shareholders benefit disproportionately. But when revenues fall short, fixed debt payments can quickly drain cash reserves and force difficult decisions.
- High equity reliance ensures financial security but may dilute ownership and slow decision-making. With more shareholders comes more voices in strategic discussions. While this can bring valuable perspectives, it can also create friction when quick pivots are necessary. Equity is expensive capital, and giving up too much too early can mean founders own a minority of the company they built.
- Balanced capital structures leverage the benefits of both debt and equity while mitigating their drawbacks. The most sophisticated companies use debt for predictable growth investments with clear ROI, while reserving equity for strategic initiatives that carry higher risk but transformational potential.
Analysis of capital structure
Determining whether a company possesses a favorable or unfavorable capital structure lacks a universal answer. There exists no one-size-fits-all solution or prescribed ratio between debt and equity. Each company necessitates individual scrutiny. The efficacy of capital allocation hinges upon:
- Company goals: Is the priority rapid growth, steady profitability, or preparing for exit?
- Industry dynamics: Capital requirements vary dramatically across sectors
- Company stage: Early-stage startups face different constraints than mature enterprises
In essence, companies, or their CFOs and financing executives, must craft a financing mix that aligns with their strategic objectives at any given juncture, while concurrently fostering financial adaptability and restraining capital costs within reasonable bounds.
Consequently, the capital structure is not a static entity but evolves in tandem with a company's progression. Nonetheless, it should embody robust adaptability and resilience.
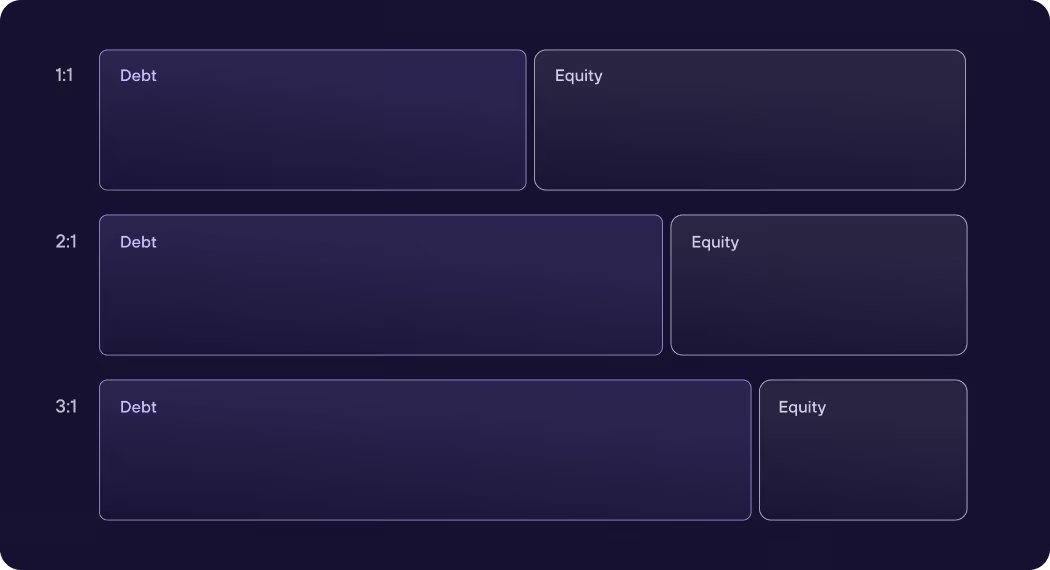
A prevalent guideline in financing principles revolves around the debt-to-equity ratio, which might be, for instance, 1:1, 2:1, or 3:1. Any deviation from the target ratio prompts the need for optimizations.
Is there an optimal capital structure?
Yes, at least in theory. The optimal capital structure is the mix of debt and equity that minimizes your company’s cost of capital (WACC) and maximizes its value. But in practice, it’s a moving target. What’s optimal today might not be tomorrow.
Your company evolves, and so do market conditions.
Start with your WACC
To get close to your optimal structure, start by calculating your WACC. This tells you how expensive your capital is, on average. Then explore how different debt-to-equity ratios affect that cost and your bottom line. Add too much debt, and risk increases.
Use only equity, and you might be paying more than you need to.
Beyond the numbers: operational realities
It’s also important to look beyond the numbers. Stable, cash-generating companies can afford more debt. Volatile or early-stage businesses usually need more equity to stay flexible.
Market factors like interest rates, investor appetite, and access to credit all play a role too. And don’t forget tax efficiency: interest on debt is tax-deductible, which can lower your effective cost.
The tax shield from debt can be substantial. If your marginal tax rate is 25% and you pay $100,000 in interest, you save $25,000 in taxes, effectively reducing your cost of debt by 25%. This is why profitable companies often carry more debt than unprofitable ones.
Finding your company’s capital structure sweet spot
So is there a perfect formula? No.
But there’s a sweet spot for your company, and it depends on your industry, growth stage, risk tolerance, and financial goals. Finding it isn’t a one-time exercise, but an ongoing balancing act.
The trade-off theory
The optimal capital structure theory rests on the trade-off theory:
Companies balance the tax benefits of debt against the costs of potential financial distress. As you add debt, WACC initially decreases due to the tax shield. But at some point, the bankruptcy risk becomes material, credit spreads widen, and WACC starts rising again. The optimal point is where WACC reaches its minimum.
Sector-specific optimal capital structures
While general principles apply across industries, the optimal capital structure varies significantly by sector. Understanding these nuances helps CFOs and finance leaders benchmark their own companies and make informed decisions.
SaaS companies: equity-heavy with strategic debt
SaaS businesses face unique capital structure challenges due to their scalability, high growth potential, and recurring revenue models. These factors profoundly influence their funding decisions.
Optimal D/E ranges by stage:
- Seed/Early stage: 0.1-0.5
- Growth stage: 1.5-3.0
- Mature stage: 0.5-1.5
Why SaaS capital structures differ
SaaS companies generate substantial upfront development costs before revenues materialize. They need capital to build products, acquire customers, and scale infrastructure. All of this needs to happen before achieving profitability. This requires ensuring access to sufficient cash to scale and reach profitability without completely diluting original shareholders.
The recurring revenue model creates unique financing opportunities. Once a SaaS company demonstrates predictable monthly or annual recurring revenue (MRR/ARR), revenue-based financing becomes particularly useful, avoiding traditional equity dilution and rigid debt repayment schedules.
Strategic debt considerations
Debt amounts for SaaS companies are typically tied to specific ratios or metrics like multiples of Annual Recurring Revenue (ARR), Monthly Recurring Revenue (MRR), or EBITDA. This means a SaaS company with €5M in ARR might access €2-3M in debt financing, depending on growth rate, churn, and unit economics.
At the €3M+ ARR threshold, more debt options become available, enabling companies to extend runway between equity rounds without excessive dilution. The information technology sector averages around 0.48 debt-to-equity ratio, as tech companies often require less physical infrastructure and can scale with relatively low capital investments.
Key metrics lenders evaluate
- ARR/MRR growth rate
- Net revenue retention
- Customer acquisition cost (CAC) payback period
- Gross margin (target: 70%+)
- Cash burn rate and runway
You can explore flexible debt funding options tailored to SaaS business models at re:cap, where you can connect your accounts and get funding estimates based on your recurring revenue metrics.
Hardware companies: debt-friendly capital structures
Hardware and manufacturing companies operate with fundamentally different capital structures than their software counterparts. Physical assets, tangible collateral, and capital-intensive operations enable higher debt ratios.
Optimal D/E ranges
- Early stage: 0.5-1.0
- Growth stage: 1.5-2.5
- Mature stage: 2.0-3.5
Why hardware companies carry more debt
Manufacturing businesses often operate with higher debt-to-equity ratios compared to consulting or software firms. The capital intensity of hardware businesses makes this necessary: machinery, inventory, facilities, and equipment require substantial upfront investment.
Traditional lenders feel comfortable with hardware companies because they can secure loans against tangible assets. If the company defaults, lenders can seize and sell equipment, inventory, or real estate to recover their capital.
This collateral reduces lender risk, enabling lower interest rates and higher loan amounts.
Capital structure advantages for hardware
Hardware companies benefit from several structural advantages in debt markets:
- Asset-backed lending: Equipment, inventory, and real estate serve as collateral
- Predictable cash flows: Manufacturing often generates steady revenues once production scales
- Working capital facilities: Revolving credit lines based on accounts receivable and inventory
- Equipment financing: Leases and loans specifically for machinery purchases
Challenges specific to hardware
Despite easier debt access, hardware companies face unique capital structure risks. High fixed costs mean operational leverage amplifies both wins and losses.
Economic downturns hit harder when you're carrying debt against depreciating physical assets. Technological obsolescence can rapidly devalue equipment that secured your loans.
The key is matching debt maturity to asset life cycles:
- Short-term debt for inventory
- Medium-term debt for equipment
- Long-term debt for facilities
Impact of the business phase on the capital structure
The influence of the business phase on the capital structure is significant. Before a company builds its capital stack, it must secure suitable access to capital. The range of options for procuring debt or equity capital shapes the capital structure.
Let's look at capital allocation. Investors analyze a company's risk profile to determine the likelihood of getting their investment repaid.
Equity financing typically entails a higher risk profile, translating to greater potential for higher returns compared to debt financing. Consequently, equity tends to be more costly than debt.
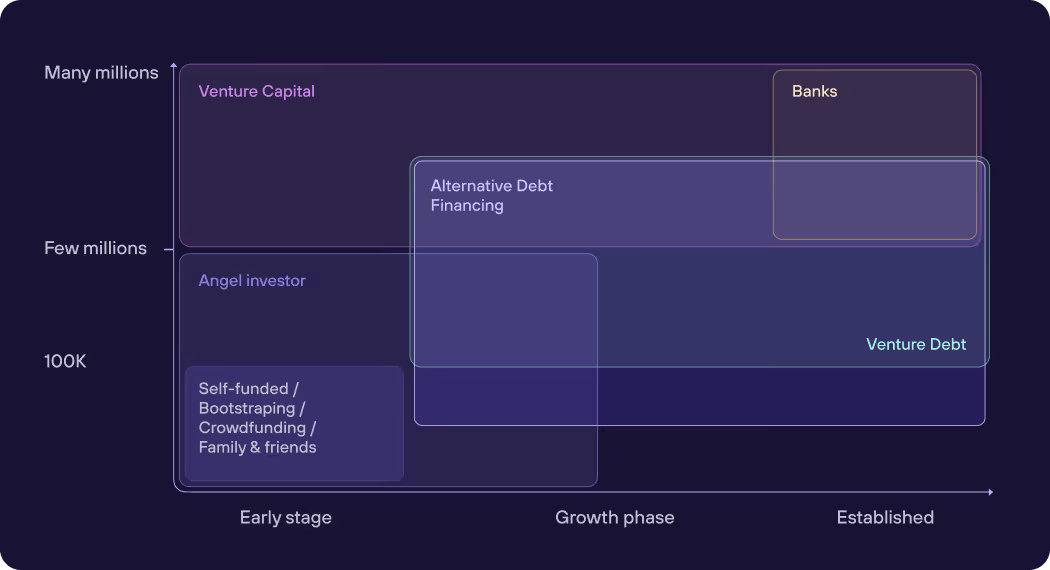
Early stage: one-sided capital structure
During the early stages, companies grapple with numerous uncertainties such as hiring, product development, and market penetration, thus bearing higher investment risks.
Given their elevated risk profile, typically characterized by a high-risk, high-return dynamic, equity capital emerges as the primary avenue to fortify their capital structure.
At this stage, venture capital, angel investors, and founder capital dominate the financing mix. Companies typically cannot access traditional debt because they lack the revenue history, profitability, and collateral that lenders require. The debt-to-equity ratio might be as low as 0.0-0.2.
However, certain alternative financing options are emerging for early-stage companies. Revenue-based financing, convertible notes, and SAFEs (Simple Agreement for Future Equity) provide middle-ground options that reduce immediate dilution while deferring valuation discussions until the company has more traction.
Growth phase: more flexibility
For companies that have passed this early stage and are generating regular revenues, the capital structure may look different. While equity remains foundational, the inclusion of debt financing for startups becomes viable.
This initial diversification of the capital structure diminishes reliance on a singular capital source, affording the company greater latitude in allocating various types of capital to different investments.
Growth-stage companies typically have:
- Proven product-market fit
- Predictable revenue streams
- Established customer base
- Clear unit economics
- Demonstrable path to profitability
These characteristics enable access to venture debt, growth equity, and even traditional bank financing. The debt-to-equity ratio might expand to 0.5-2.0 depending on the sector and business model.
Strategic use of debt at this stage extends runway between equity rounds, allowing companies to hit higher valuation milestones before raising their next round. This minimizes dilution and maximizes founder and early investor returns.
Established companies: various options
Established firms boasting a robust customer base and stable revenues enjoy a multitude of options. They can self-finance investments from internal resources or tap into external capital providers.
Accessing loans from banks becomes more feasible, and depending on their legal structure, they may even venture into refinancing endeavors within the capital market.
Mature companies can access:
- Corporate bonds
- Public equity markets
- Syndicated loans
- Private placements
- Asset-backed securities
- Revolving credit facilities
The debt-to-equity ratio for mature companies varies by industry but often ranges from 0.5-3.0. Established companies typically optimize for WACC minimization while maintaining financial flexibility for strategic initiatives like acquisitions or major capital investments.
Impact of the business model on the capital structure
Capital allocation and, consequently, the structure of capital are not solely contingent on the company's stage of development. Another pivotal aspect is the business model and the collateral associated with it.
Companies endowed with physical assets such as real estate, machinery, or fleets typically find themselves in a position to integrate debt into their capital structure at an earlier stage.
The risk assessment of traditional banks and financial institutions are tailored around these tangible assets. Such business models are often categorized as "asset-heavy."
"Asset-light" or "Asset-heavy" affects the capital structure
For companies with an "asset-light" business model, the landscape is notably different. Unlike their counterparts with tangible assets, they lack physical assets to serve as collateral. Instead, their collateral is intangible assets such as software products, customer contracts, and recurring revenues.
This distinctive form of collateral places them beyond the purview of traditional debt providers' risk assessments. Traditional lenders struggle to evaluate such intangible assets, often leading to reluctance in extending debt capital to "asset-light" business models.
Consequently, the accessibility of debt capital becomes a challenge for tech- and digital-savvy companies. They find themselves less able to incorporate debt into their capital structure and thus rely more heavily on equity financing, necessitating the sale of company shares.
This creates a fundamental disadvantage: equity is more expensive than debt, both in terms of expected returns and in the dilution of founder and early investor ownership.
New approaches in risk analysis
To effectively assess the risks associated with such business models, novel risk analysis methodologies and a reevaluation of the risk-return profile are imperative. These modern approaches are founded on daily-calculated data and tailored metrics.
Modern debt providers prioritize insights into revenues, visibility into cash flow, accounting practices, and customer bases to make informed lending decisions.
Earlier access to debt for tech companies
One groundbreaking aspect of these new risk approaches is the provision of access to debt financing at earlier stages of a tech company's lifecycle. Historically, they have primarily relied on equity financing due to the perceived riskiness of their ventures.
Yet, by utilizing sophisticated risk assessment models, modern funding providers can offer debt tailored to the specific needs and risk profiles of asset-light businesses, enabling them to access capital more efficiently.
For example, alternative lenders now evaluate:
- Monthly recurring revenue growth rates
- Customer cohort retention curves
- Net revenue retention metrics
- Customer lifetime value to acquisition cost ratios
- Cash conversion cycles
- Forward-looking revenue visibility
These metrics provide a more accurate picture of a SaaS or tech company's ability to service debt than traditional balance sheet analysis.
Sophisticated models for asset-light businesses
Moreover, these innovative risk assessment approaches enable tech companies to demonstrate their creditworthiness more effectively. By incorporating non-traditional metrics, alternative funding providers can gain a comprehensive understanding of a tech company's growth potential and mitigate perceived risks.
The early access to debt financing afforded by these new risk assessment methodologies empowers tech companies to diversify their funding sources and optimize their capital structure strategically.
This shift is transforming how asset-light companies approach capital structure. What was once a binary choice between dilutive equity rounds is now a spectrum of options including:
- Revenue-based financing
- Recurring revenue loans
- Growth debt with equity warrants
- Venture debt linked to venture rounds
- Asset-based lending on accounts receivable
How to optimize capital structure
For a company to even be in a position to optimize its capital structure, it also depends on the factors mentioned above. However, when the optimization of the capital structure is on the table, it can proceed in the following steps:

1. Analysis of the current situation
The initial step involves conducting a thorough assessment of the present circumstances. This entails identifying the strengths and weaknesses inherent in existing sources of financing. Such an evaluation encompasses an analysis of financial statements, cash flow projections, and credit terms. The overarching objective is to ascertain the prevailing capital costs, debt levels, and cash position.
Key questions to answer
- What is our current debt-to-equity ratio?
- How does our WACC compare to industry benchmarks?
- Are we overleveraged or underleveraged relative to peers?
- What constraints do existing covenants place on our flexibility?
- Do we have sufficient liquidity for planned growth initiatives?
- What is our debt maturity schedule and refinancing risk?
2. Setting objectives
The second phase in optimizing a company's capital structure revolves around establishing goals that harmonize with the strategic objectives and risk profile of the organization. This entails conducting a comprehensive evaluation of diverse scenarios and meticulously assessing the trade-offs between debt and equity options.
Strategic considerations
- Growth plans: Are we preparing for rapid expansion or steady state?
- Exit timeline: Is an IPO or acquisition on the horizon?
- Cash flow stability: Can we handle fixed debt payments reliably?
- Control preferences: How important is maintaining founder control?
- Market conditions: Are interest rates favorable for borrowing?
3. Implementing measures
The third step is to implement an action plan that guides the company from the current situation to the goal. This may involve various measures:
- Repayment of debts or refinancing: Reduce expensive debt or refinance at lower rates
- Increase or decrease in equity: Raise new equity rounds or execute share buybacks
- Optimization of working capital: Improve cash conversion cycles to reduce funding needs
- Sale of assets or M&A: Divest non-core assets or acquire complementary businesses
Implementation timeline considerations
The pace of optimization matters. Moving too quickly can disrupt operations or spook investors. Moving too slowly means missed opportunities. Most companies approach major capital structure shifts over 12-24 month periods, making incremental adjustments as conditions allow.
4. Risk management
The fourth step involves managing risks and opportunities that may arise from the new capital structure.
Risks may include
- Interest rate risks: Rising rates increase debt servicing costs
- Credit risks: Downgrades can trigger higher rates or covenant violations
- Covenants: Restrictive terms that limit operational flexibility
- Refinancing risks: Inability to roll over maturing debt
- Dilution risks: Additional equity raises reducing existing shareholders' stakes
Opportunities may include
- Lower capital costs through diversification of total capital: Accessing new funding sources
- Higher profitability through leverage effects: Amplifying returns when debt costs less than returns
- Improved competitive position enabling strategic investments: Financial flexibility to pursue acquisitions or R&D
- Tax efficiency gains: Maximizing the tax deductibility of interest expenses
Case study: capital structure
Real-world perspectives from CFOs and finance leaders provide invaluable context for capital structure decisions.
Case study: SaaS company scales with hybrid financing
- Company profile: Mid-market SaaS company, €8M ARR, 150% net revenue retention
- Challenge: The company had reached product-market fit with strong unit economics but needed €5M to accelerate growth. A pure equity raise would have resulted in 25% dilution at their current valuation.
- Solution: The CFO structured a hybrid approach: €2M equity round plus €3M revenue-based financing. This reduced dilution to 10% while providing the necessary growth capital.
- CFO perspective: "Revenue-based financing changed everything for us. We were able to maintain founder control while still investing aggressively in sales and marketing. The flexibility to repay from revenue meant we didn't strain our balance sheet during seasonal fluctuations."
Outcome: The company grew to €18M ARR within 18 months, raised a Series A at 3x higher valuation, and founders retained 65% ownership instead of the 45% they would have held with pure equity financing.
Case study: Hardware startup leverages asset-based lending
- Company profile: Consumer electronics startup, pre-revenue but with purchase orders
- Challenge: Manufacturing hardware requires significant upfront capital for tooling, inventory, and production. The company had €2M in confirmed purchase orders but couldn't fulfill them without €800K in working capital.
- Solution: The finance team structured an asset-based lending facility secured by purchase orders and inventory. This provided 80% advance rate on purchase orders and 50% on inventory.
- CFO perspective: "Traditional VCs wanted too much equity for bridge financing. Asset-based lending made perfect sense because we had tangible collateral and a clear path to repayment within 90 days of production."
Outcome: The company fulfilled initial orders, generated €1.8M in revenue, and used positive cash flow to finance subsequent production runs with minimal additional dilution.
Optimal capital structure continues to evolve
The fundamental tenets of a robust capital structure remain consistent across all companies. They should embody:
- Resilience: Ability to weather economic downturns without defaulting
- Flexibility: Room to maneuver when opportunities or challenges arise
- Alignment: Structure matches business model, growth stage, and strategic objectives
However, the dynamics of the capital stack and how companies interact with it are contingent upon their stage of development and business model.
Early-stage limitations
In the early stages, companies encounter limitations in shaping their capital structure. Securing debt capital proves challenging, compelling them to primarily rely on venture capital and other forms of risk financing.
Yet, as they progress and attain further growth milestones, avenues for diversification emerge. With maturity comes an enhanced ability to shape the capital structure to better suit evolving needs.
The key inflection points typically occur around:
- First revenue milestone: Opens access to revenue-based financing
- €1M ARR (for SaaS): Venture debt becomes available
- Profitability or near-profitability: Traditional bank financing accessible
- €10M+ revenue: Senior secured credit facilities possible
Breaking barriers for asset-light companies
Traditionally, "asset-light" companies have grappled with hurdles in diversifying their capital structure due to the intangible nature of their assets. However, recent years have witnessed a transformative shift.
Emerging debt providers have pioneered risk assessment methodologies capable of appraising intangible assets as viable collateral.
Consequently, particularly in sectors like technology, digital services, and Software as a Service (SaaS), these companies now enjoy improved access to debt capital.
This evolution represents a fundamental change in how financial markets value and finance digital-first business models. The recognition that recurring revenue streams and strong unit economics can serve as reliable collateral has opened new financing pathways that simply didn't exist a decade ago.
Key takeaways: Capital structure
- Capital structure optimization is ongoing, not a one-time decision
- Sector-specific factors dramatically influence optimal debt-to-equity ratios
- Modern risk assessment enables earlier debt access for tech companies
- Strategic capital structure decisions balance cost, control, and flexibility
- WACC minimization guides optimal structure, but operational realities matter equally
Summary: Capital structure
Capital structure is the balance of debt and equity a company uses for funding. Traditionally, asset-heavy companies secure debt more easily, while asset-light businesses rely on equity due to limited collateral.
However, evolving risk assessments and alternative financing now provide asset-light firms with earlier access to debt.
This shift allows tech companies to diversify funding sources, reduce capital costs, and optimize financial flexibility.
By strategically adjusting their capital structure based on growth stages and market conditions, companies can enhance stability, attract investors, and improve long-term profitability while balancing risk and opportunity in their financial strategy.
The emergence of alternative debt providers using sophisticated metrics means asset-light businesses no longer face a binary choice between expensive equity and inaccessible debt. Instead, they can now thoughtfully layer different capital sources to optimize for their specific situation, stage, and objectives.
Q&A: Capital structure
What is meant by capital structure?
Capital Structure refers to the combination of different sources of funds that a company uses to finance its operations and investments. It includes equity (such as common and preferred stock) and debt (such as loans and bonds), which are detailed in a company's balance sheet.
The proportion of debt and equity in a company's capital structure is crucial because it affects the company's financial health, risk profile, and cost of capital.
What is an example of a capital structure?
Here are some examples of capital structures used by well-known companies:
1. Apple Inc.
- Capital Structure: Hybrid, with a mix of debt and equity.
- Strategy: Apple uses retained earnings and strategic debt financing for share buybacks and dividend payouts, benefiting from low-interest rates while maintaining profitability..
- Benefits: This approach allows Apple to minimize risk, maximize shareholder value, and maintain financial flexibility.
2. Tesla Inc.
- Capital Structure: Heavily reliant on equity financing, especially during its early years.
- Strategy: Tesla has used equity financing to fund research and development and growth initiatives, reducing financial risk during its high-growth phase.
- Benefits: This approach has enabled Tesla to pursue ambitious expansion plans and invest in innovation.
3. Coca-Cola Company
- Capital Structure: Balanced, combining debt and equity financing.
- Strategy: Coca-Cola maintains a solid credit rating to access low-cost debt capital, supporting long-term growth objectives while preserving shareholder value.
- Benefits: This balanced approach allows Coca-Cola to finance operations and acquisitions sustainably.
What are the four theories of capital structure?
- Modigliani-Miller Theorem (MM Theory): Proposes that in perfect markets with no taxes, bankruptcy costs, agency costs, or asymmetric information, the value of a firm is unaffected by how it is financed. Capital structure is irrelevant to firm value.
- Agency Cost Theory: Focuses on how capital structure can help mitigate conflicts of interest between shareholders, managers, and debtholders. Debt can discipline managers but also create conflicts between shareholders and debt holders.
- Trade-off Theory: Suggests firms balance the benefits of debt (tax shields) against the costs of financial distress. Companies seek an optimal debt-to-equity ratio that maximizes firm value by trading off these advantages and disadvantages.
- Pecking Order Theory: Argues that firms prefer internal financing over external financing, and debt over equity when external financing is required. This preference hierarchy exists due to information asymmetry between managers and investors.
What is the formula of capital structure?
The formula for capital structure is typically represented as the ratio of a company's debt to equity. The most common way to express it is:
Capital structure = Debt / Equity
Where:
- Debt refers to the total amount of a company's liabilities (both short-term and long-term).
- Equity refers to the shareholders' equity, which is the difference between the company's total assets and total liabilities.
This ratio is used to assess the financial leverage of a company and helps to understand how a company finances its operations through debt versus equity.
Alternatively, some may look at capital structure in terms of the proportion of debt and equity in the company's total capital:
- Debt Ratio = Total Debt / (Total Debt + Equity)
- Equity Ratio = Equity / (Total Debt + Equity)
How often should companies reevaluate their capital structure?
Companies should review capital structure at minimum annually, but trigger events may require immediate evaluation:
- Significant revenue or profitability milestones
- Major fundraising rounds
- Market interest rate changes exceeding 1-2%
- Strategic acquisitions or divestitures
- Covenant violations or near-violations
- Dramatic shifts in business model or growth trajectory
Leading CFOs treat capital structure as a dynamic strategic tool, not a static financial characteristic.
What's the difference between capital structure and capital stack?
While often used interchangeably, these terms have subtle differences:
- Capital structure refers to the overall mix and proportions of debt and equity financing a company uses. It's the high-level view: "We're 60% equity, 40% debt."
- Capital stack refers to the specific layers and hierarchy of different financing instruments, including their seniority, security, and terms. It's the detailed view: "We have €2M senior secured debt, €1M subordinated debt with warrants, €500K convertible notes, €2M Series A preferred, and €1.5M common equity."
Think of capital structure as the forest, capital stack as the trees.
Can a company have too little debt?
Yes. While excessive debt creates obvious risks, insufficient debt also creates problems:
- Higher WACC: You're using expensive equity where cheaper debt would work
- Excessive dilution: Founders and early investors own less than necessary
- Missed tax benefits: Foregoing valuable interest tax deductions
- Weak signaling: Markets may interpret zero debt as lack of confidence or inability to access credit
- Inflexibility: When you finally need debt, you'll lack relationships and track record
How much funding could you get from re:cap?
Find out if your company is ready for debt financing in 60 seconds
Check fundability now